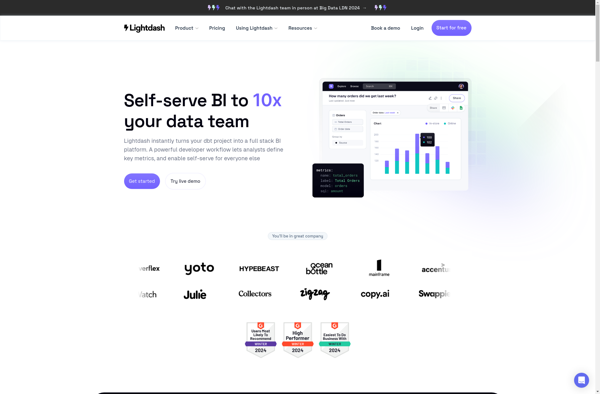
Lightdash is an open-source business intelligence and data visualization tool. It allows you to connect to databases and build interactive reports and dashboards to analyze your data visually.
Lightdash: Open-Source Business Intelligence & Data Visualization Tool
Connect to databases, build interactive reports and dashboards for visual data analysis with Lightdash, an open-source business intelligence and data visualization tool.
What is Lightdash?
Lightdash is an open-source business intelligence and analytics platform for building interactive dashboards and reports. It allows you to visualize and explore your data to uncover insights and make better decisions.
Some key features and capabilities of Lightdash include:
Connect to a wide range of data sources like MySQL, PostgreSQL, BigQuery, and more
Intuitive drag-and-drop interface to build dashboards with charts, tables, filters, and other widgets
Support for complex data transformations and calculations
Interactive drill-down and slicing to filter and explore data
Scheduled reports and alerts to share insights
Access control and governance capabilities
Open-source under the AGPL license with free community support
Lightdash is built for self-service BI and helps democratize data access and analytics across teams and organizations. With its rich visualization capabilities and flexibility to work with diverse data sources, Lightdash is a great open-source alternative to proprietary tools like Tableau, Looker, or Power BI.
Microsoft Power BI is a powerful business analytics service developed by Microsoft. It empowers users to transform raw data into meaningful insights, create interactive reports and dashboards, and share data-driven stories within an organization. Power BI is designed to help businesses and individuals make informed decisions based on a comprehensive...
Tableau is a leading business intelligence and data visualization platform used by organizations of all sizes to transform their data into easy-to-understand visualizations and dashboards. With Tableau, users can connect to a wide range of data sources, prepare and clean the data for analysis, and create interactive data visualizations such...
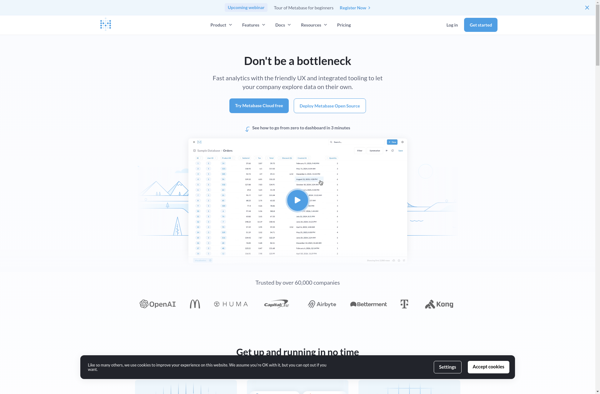
Metabase is an open source business intelligence platform and analytics tool. It allows anyone on a team to ask questions about their data, explore it, and share insights with others through easy-to-create dashboards, charts, and visualizations. Metabase provides an intuitive frontend interface so users can get answers and discover trends...
Looker Studio is a business intelligence and analytics platform designed to help companies analyze data and gain valuable insights. It provides an intuitive, web-based interface that enables users without technical skills to explore, visualize and share data easily.Some key capabilities and benefits of Looker Studio include:Interactive dashboards - Users can...
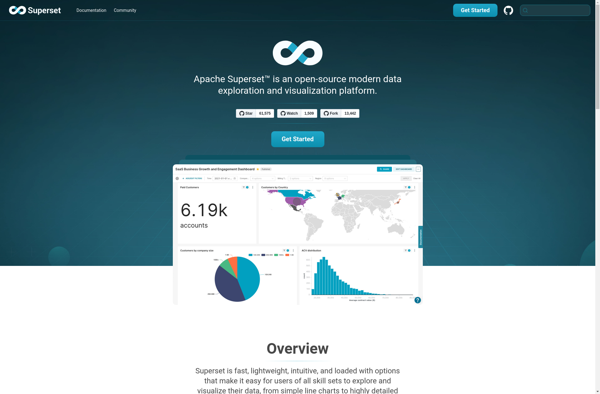
Apache Superset, formerly known as Caravel, is an open-source business intelligence (BI) web application. It was created by Maxime Beauchemin at Airbnb.Superset allows you to explore and visualize data, create interactive dashboards, and share insights across your organization. It integrates with common database technologies like MySQL, Postgres, SQL Server, and...
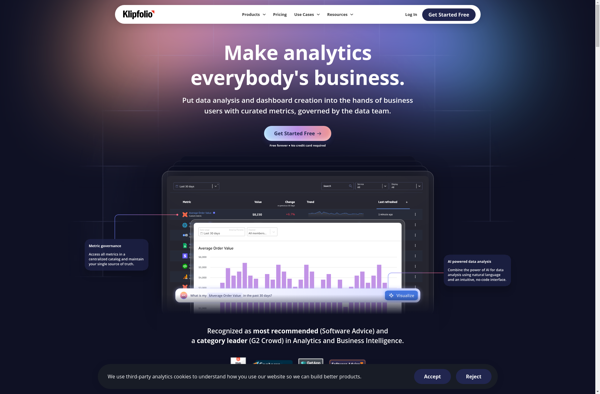
Klipfolio PowerMetrics is a flexible, cloud-based business intelligence and data visualization platform designed to help businesses gain insights from their data. Some key features include:Customizable dashboards - Users can build interactive dashboards with charts, graphs, tables, images and more to visualize key data.Real-time data connectivity - Connect to cloud apps,...
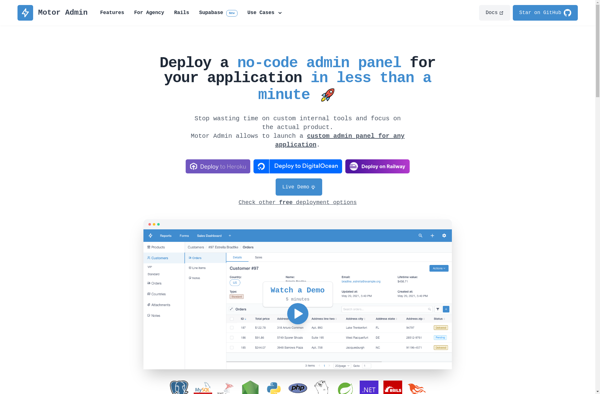
Motor Admin is an end-to-end dealership management software designed specifically for automobile dealerships. It provides a centralized platform to manage key aspects of running a dealership including:Inventory Management - Track all vehicles from acquisition to sale, including accounting, reconditioning and promotions. Manage inventory across multiple locations.Customer Relationship Management - Store...
Redash is an open-source business intelligence and data visualization web application. It allows users to connect to multiple data sources including SQL databases, query and visualize the data, and create interactive dashboards to share insights.Some key features of Redash:Connect to data sources like PostgreSQL, MySQL, SQL Server, Redshift, BigQuery and...
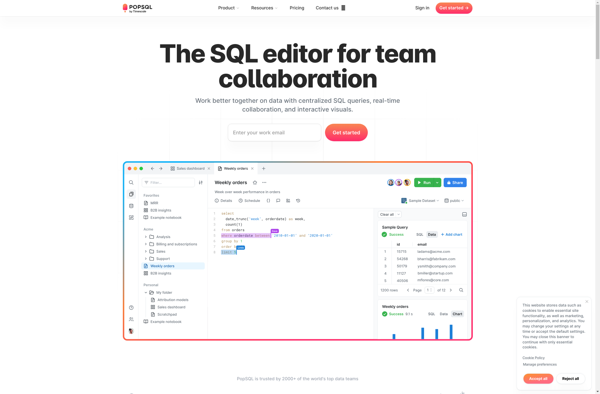
PopSQL is a cloud-based SQL editor that enables teams to collaborate on exploring and analyzing data. It provides an intuitive, browser-based interface for writing queries, visualizing results, and sharing data insights.Key features of PopSQL include:Collaborative editing - Multiple users can query the same datasets, share queries and visualizations, comment, and...
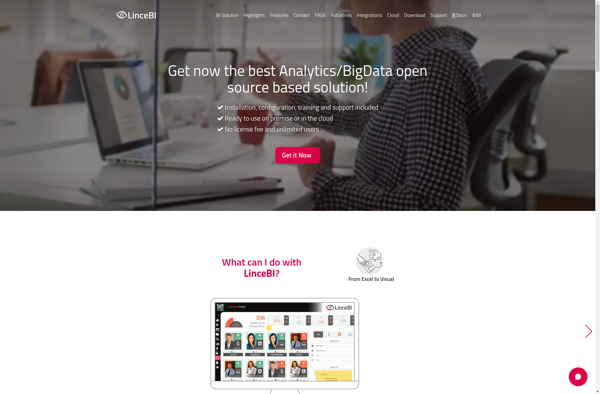
LinceBI is an open-source business intelligence and data visualization platform used to analyze and visualize data for better business insights. It provides an intuitive drag-and-drop interface to create interactive dashboards, reports, charts and graphs without the need for coding.Some key features of LinceBI include:Connectivity to multiple data sources such as...
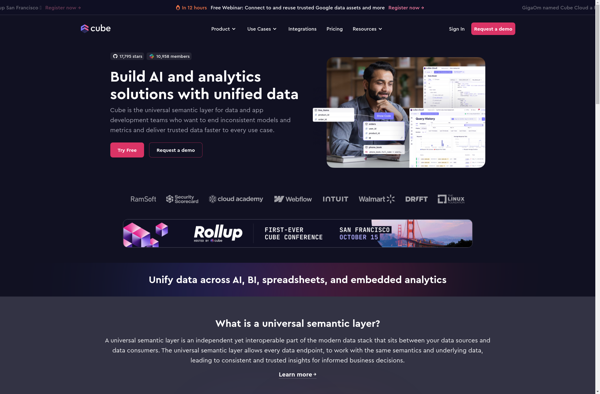
Cube.js is an open-source analytics framework for building cloud-native business intelligence dashboards and applications. It provides a flexible way to analyze and visualize data by generating a data model on top of data warehouses or databases.Some key capabilities and benefits of Cube.js include:Auto-generating a data schema to power analystics dashboards...
The Syncfusion Dashboard Platform is a comprehensive business intelligence and analytics solution designed specifically for data visualization and dashboard creation. It allows you to connect to almost any data source, including SQL databases, Excel files, REST APIs, and more, and transform that data into stunning, interactive dashboards.With an intuitive drag-and-drop...
Marple is an open-source, Markdown-based slide deck tool for creating presentations. It provides a minimalistic editor interface to write slide content in Markdown format, which then gets rendered into an elegant slide deck for presenting.Some key features of Marple:Write slide content in easy-to-read and write Markdown format. Format headings, lists,...
Cirkulate is an open-source, self-hosted alternative to Google Analytics that allows web developers and site owners to track traffic and analyze usage statistics without compromising visitor privacy. Some key features of Cirkulate include:Lightweight and easy to install. Cirkulate uses a SQLite database and PHP scripts, making it simple to set...
Revere is a powerful software platform that enables companies to easily create sophisticated conversational experiences like chatbots and digital assistants. Its drag-and-drop, no-code tools allow anyone, even without technical expertise, to visually assemble conversation flows, inserting logic, variables, integrations with other systems and more to automate interactions.Revere also provides low-code...