LinceBI is an open-source business intelligence and data visualization software. It allows users to connect to various data sources, build dashboards and reports, and analyze data through charts, tables, maps and other visualizations.
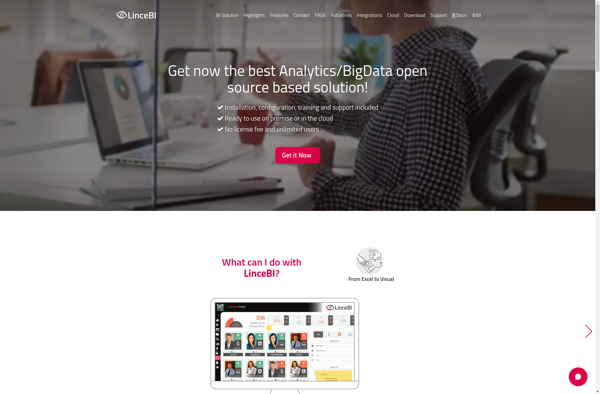
LinceBI: Open-Source Business Intelligence & Data Visualization Software
Connect to various data sources, build dashboards and reports, and analyze data through charts, tables, maps and other visualizations with LinceBI, an open-source business intelligence solution.
What is LinceBI?
LinceBI is an open-source business intelligence and data visualization platform used to analyze and visualize data for better business insights. It provides an intuitive drag-and-drop interface to create interactive dashboards, reports, charts and graphs without the need for coding.
Some key features of LinceBI include:
Connectivity to multiple data sources such as SQL, NoSQL databases, cloud data warehouses, Excel, CSV files etc.
Drag-and-drop interface to build dashboards with various widgets like charts, tables, gauges, maps etc.
Exploration and discovery features like filtering, drilling down, sorting, exporting and scheduling.
Robust security options for user and data access control.
On-premises and multi-cloud deployment options.
Large library of data visualizations and ability to create custom visuals.
Collaboration through features like annotations, sharing and white-labeling.
APIs and integrations with third-party apps.
With its code-free development and broad data connectivity, LinceBI enables organizations to tap into their data, uncover insights faster and make data driven decisions. Its open-source and customizable architecture also makes it cost-effective for analytics and reporting needs.
LinceBI Features
Features
Drag-and-drop interface for building dashboards
Connects to various data sources like SQL, NoSQL, CSV, REST, etc
Supports data modeling and ETL
Has a library of customizable charts, tables, maps, etc
Can schedule and email reports
Has role-based access control and sharing
Pricing
Open Source
Free
Pros
Free and open source
Easy to use visual interface
Connects to many data sources
Good for building interactive dashboards
Can handle large data volumes
Cons
Limited built-in ETL and data modeling capabilities
Not as feature rich as some commercial BI tools
Lacks some advanced analytics functions
Smaller community than larger open source projects
Microsoft Power BI is a powerful business analytics service developed by Microsoft. It empowers users to transform raw data into meaningful insights, create interactive reports and dashboards, and share data-driven stories within an organization. Power BI is designed to help businesses and individuals make informed decisions based on a comprehensive...
Tableau is a leading business intelligence and data visualization platform used by organizations of all sizes to transform their data into easy-to-understand visualizations and dashboards. With Tableau, users can connect to a wide range of data sources, prepare and clean the data for analysis, and create interactive data visualizations such...
JasperReports is an open source Java reporting library that can generate various types of reports from different data sources. It is very flexible and offers many features:Supports connecting to various data sources like SQL databases, NoSQL databases, XML, JSON, CSV files, etc.Can generate reports in multiple formats including PDF, HTML,...
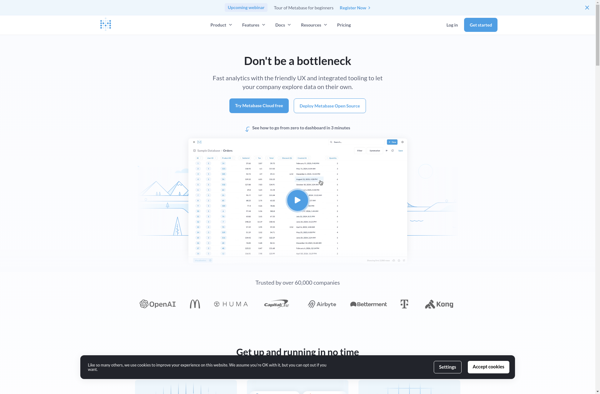
Metabase is an open source business intelligence platform and analytics tool. It allows anyone on a team to ask questions about their data, explore it, and share insights with others through easy-to-create dashboards, charts, and visualizations. Metabase provides an intuitive frontend interface so users can get answers and discover trends...
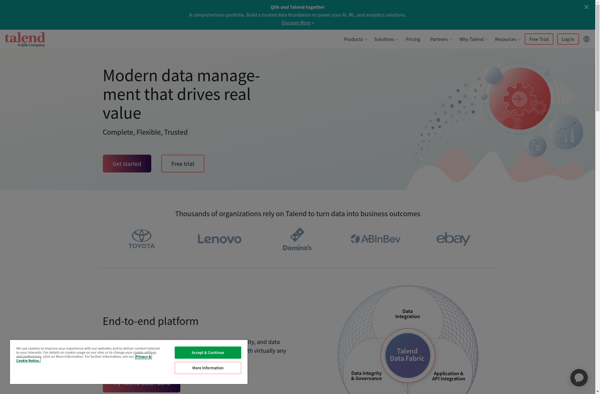
Talend is an open source data integration and management platform designed to help organizations effectively collect, transform, cleanse and share data across systems and teams. Some key capabilities and benefits of Talend include:Graphical drag-and-drop interface to build data integration jobs and workflows without codingOver 900 pre-built data connectors to leading...
QlikView is a business intelligence and data visualization platform used to create interactive dashboards and analytics applications. It was first released in 1993 by the Swedish company Qlik. Key features of QlikView include:Associative data modeling and in-memory analytics engine - Allows fast analysis of large, disparate datasets without predefined schema...
Pentaho is a comprehensive open source business intelligence (BI) suite that provides a range of data integration, analytics, visualization, reporting, data mining, and workflow capabilities. It is designed to help businesses consolidate data from disparate sources for unified analytics and reporting.Some of the key capabilities and components of Pentaho include:Data...
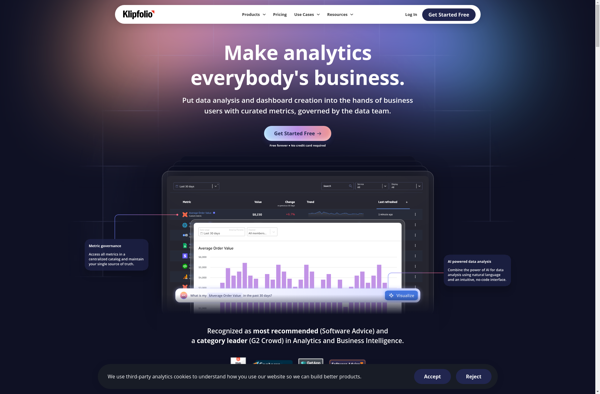
Klipfolio PowerMetrics is a flexible, cloud-based business intelligence and data visualization platform designed to help businesses gain insights from their data. Some key features include:Customizable dashboards - Users can build interactive dashboards with charts, graphs, tables, images and more to visualize key data.Real-time data connectivity - Connect to cloud apps,...
SpagoBI is an open-source business intelligence (BI) suite that provides a wide range of analytical and reporting capabilities for data analysis and visualization. It allows organizations to build interactive dashboards, reports, charts, widgets and what-if analysis to get valuable insights from their data.Some of the key features of SpagoBI include:Interactive...
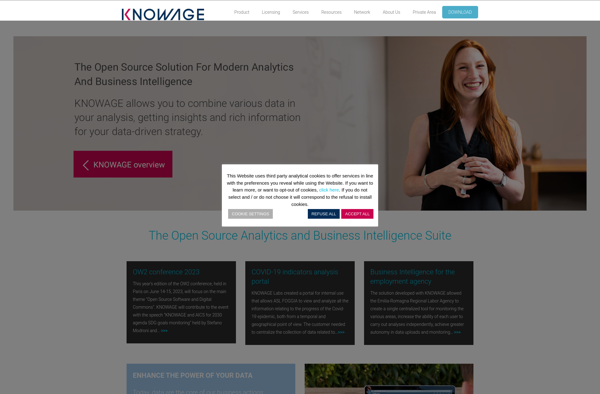
Knowage is an open-source business intelligence and data analytics platform. It provides a wide range of features for extracting insights from data, including:Interactive dashboards and reports for data visualizationAd-hoc reporting and analysisAdvanced data visualization with charts, graphs, and mapsData mining and OLAP analysisScorecards and KPI managementData integration from multiple sourcesResponsive...
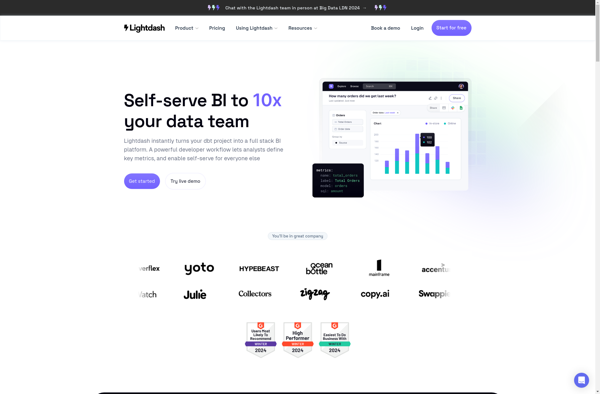
Lightdash is an open-source business intelligence and analytics platform for building interactive dashboards and reports. It allows you to visualize and explore your data to uncover insights and make better decisions.Some key features and capabilities of Lightdash include:Connect to a wide range of data sources like MySQL, PostgreSQL, BigQuery, and...
Bime is a flexible business intelligence and analytics platform suitable for modern data teams. It provides an easy way to connect to various data sources like databases, cloud apps, and business software to build interactive dashboards, reports, and analytics.Some key capabilities and benefits of Bime include:Intuitive drag-and-drop interface to visualize...