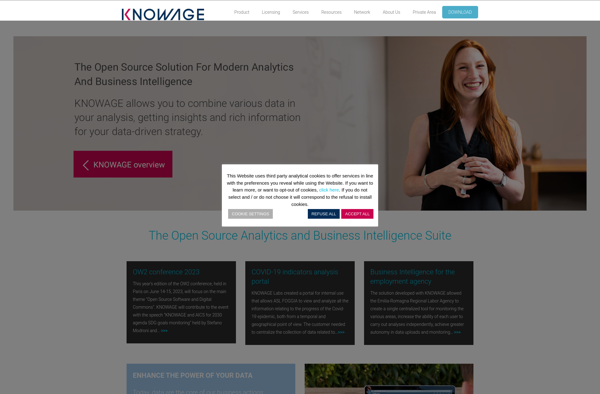
Knowage is an open-source business intelligence suite that provides features for data visualization, reporting, dashboarding, and more. It is designed to help companies analyze data and gain insights.
Knowedge is an open-source business intelligence suite that provides features for data visualization, reporting, dashboarding, and more. It is designed to help companies analyze data and gain insights.
What is KNOWAGE?
Knowage is an open-source business intelligence and data analytics platform. It provides a wide range of features for extracting insights from data, including:
Interactive dashboards and reports for data visualization
Ad-hoc reporting and analysis
Advanced data visualization with charts, graphs, and maps
Data mining and OLAP analysis
Scorecards and KPI management
Data integration from multiple sources
Responsive design for access on any device
Some key benefits of Knowage include: customizability with XML templates, a plugin architecture for extensibility, support for big data sources, data governance capabilities, and a focus on self-service BI. It can be deployed on-premises or in the cloud.
Knowage is well-suited for companies looking for an open-source alternative to proprietary BI tools like Tableau, Microsoft Power BI, or QlikView. It provides enterprise-grade capabilities at a fraction of the cost. With its large community and ecosystem, Knowage is a viable open-source option for analytics and reporting.
KNOWAGE Features
Features
Interactive dashboards
Ad-hoc reporting
Data visualization
ETL capabilities
Mobile app for data access
Integration with R and Python for advanced analytics
Metadata management
Data governance features
Scalability to large data volumes
Pricing
Open Source
Pros
Open source and free
Highly customizable and extensible
Strong visualization capabilities
Can handle large, complex datasets
Good support for real-time data analysis
Integrates with major databases and data sources
Cons
Steep learning curve
Less intuitive than some commercial BI tools
Limited pre-built content and templates
Requires more hands-on coding/scripting than some BI platforms
Not as suitable for simple dashboards or standard reporting
Microsoft Power BI is a powerful business analytics service developed by Microsoft. It empowers users to transform raw data into meaningful insights, create interactive reports and dashboards, and share data-driven stories within an organization. Power BI is designed to help businesses and individuals make informed decisions based on a comprehensive...
Tableau is a leading business intelligence and data visualization platform used by organizations of all sizes to transform their data into easy-to-understand visualizations and dashboards. With Tableau, users can connect to a wide range of data sources, prepare and clean the data for analysis, and create interactive data visualizations such...
JasperReports is an open source Java reporting library that can generate various types of reports from different data sources. It is very flexible and offers many features:Supports connecting to various data sources like SQL databases, NoSQL databases, XML, JSON, CSV files, etc.Can generate reports in multiple formats including PDF, HTML,...
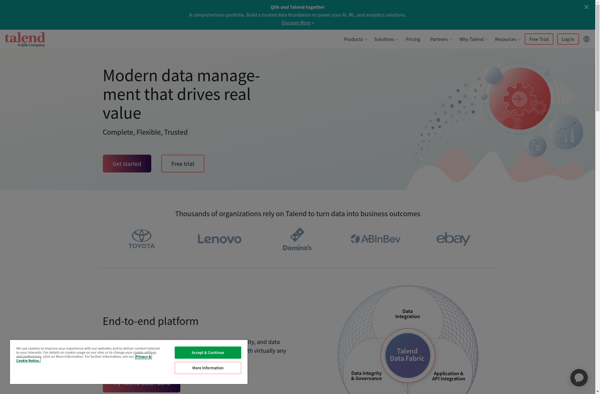
Talend is an open source data integration and management platform designed to help organizations effectively collect, transform, cleanse and share data across systems and teams. Some key capabilities and benefits of Talend include:Graphical drag-and-drop interface to build data integration jobs and workflows without codingOver 900 pre-built data connectors to leading...
QlikView is a business intelligence and data visualization platform used to create interactive dashboards and analytics applications. It was first released in 1993 by the Swedish company Qlik. Key features of QlikView include:Associative data modeling and in-memory analytics engine - Allows fast analysis of large, disparate datasets without predefined schema...
Pentaho is a comprehensive open source business intelligence (BI) suite that provides a range of data integration, analytics, visualization, reporting, data mining, and workflow capabilities. It is designed to help businesses consolidate data from disparate sources for unified analytics and reporting.Some of the key capabilities and components of Pentaho include:Data...
AnswerMiner is an artificial intelligence-powered software that helps companies improve their customer support operations and experiences. It analyzes large volumes of customer service conversation data, including emails, chat transcripts, and call center notes, to provide actionable insights.The key features and benefits of AnswerMiner include:Understanding Frequent Customer Questions and Pain Points:...
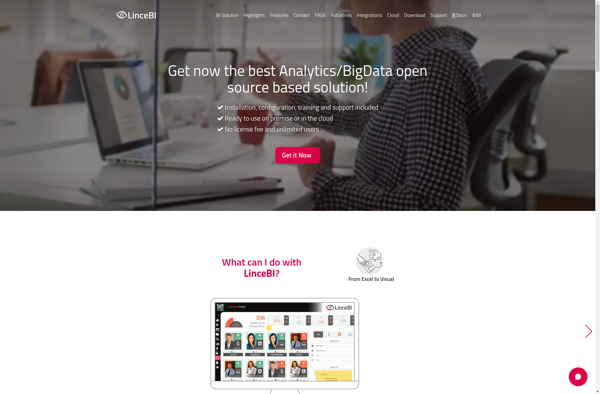
LinceBI is an open-source business intelligence and data visualization platform used to analyze and visualize data for better business insights. It provides an intuitive drag-and-drop interface to create interactive dashboards, reports, charts and graphs without the need for coding.Some key features of LinceBI include:Connectivity to multiple data sources such as...
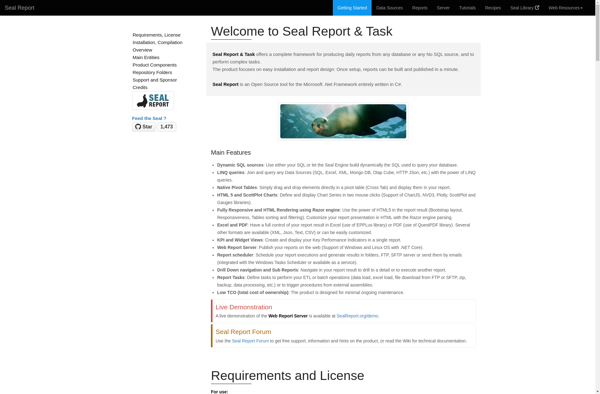
Seal Report is an open source business intelligence and reporting software. It provides an intuitive graphical interface and drag & drop features to easily create interactive dashboards, charts, reports and perform data analysis without needing coding skills.Key features of Seal Report include:Connect to multiple data sources like MySQL, PostgreSQL, Microsoft...
Marple is an open-source, Markdown-based slide deck tool for creating presentations. It provides a minimalistic editor interface to write slide content in Markdown format, which then gets rendered into an elegant slide deck for presenting.Some key features of Marple:Write slide content in easy-to-read and write Markdown format. Format headings, lists,...
Snapshot BI is a business intelligence and analytics software designed specifically for small and medium-sized businesses. It provides an easy-to-use platform for companies to visualize, analyze, and gain actionable insights from their business data.Key features of Snapshot BI include:Interactive dashboards and reports - Create customized dashboards with drag-and-drop widgets to...