Snapshot BI
Snapshot BI is a business intelligence and analytics platform designed for small and medium-sized businesses. It provides easy-to-use data visualization and reporting tools to help companies gain insights from their data.
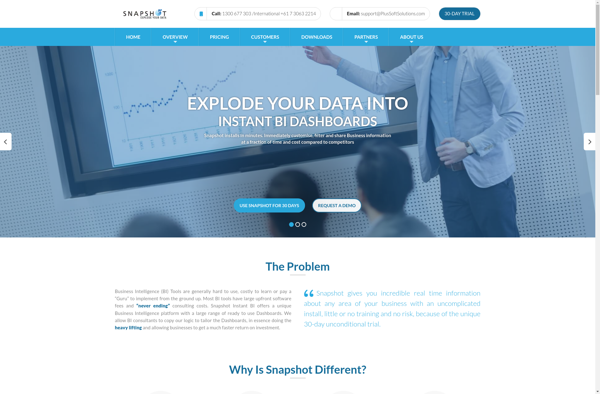
Snapshot BI: Business Intelligence Platform
A business intelligence platform for small & medium-sized businesses, providing easy-to-use data visualization & reporting tools for gaining insights from data
What is Snapshot BI?
Snapshot BI is a business intelligence and analytics software designed specifically for small and medium-sized businesses. It provides an easy-to-use platform for companies to visualize, analyze, and gain actionable insights from their business data.
Key features of Snapshot BI include:
- Interactive dashboards and reports - Create customized dashboards with drag-and-drop widgets to track KPIs. Reports can be scheduled and shared across the organization.
- Data visualization - Charts and graphs like line, bar, pie, scatter plots etc. make it easy to spot trends and patterns in data.
- Ad-hoc analysis - Intuitively filter, sort, summarize or drill-down into your data without SQL or coding.
- Data integration - Easily connect data from a variety of sources such as SQL, MySQL, Postgres, Excel, CSVs and other databases.
- Collaboration - Annotate, discuss insights and collaborate with teammates through mentions, chat and interactive storytelling.
With an intuitive interface, affordable pricing and reliable support, Snapshot BI is designed to make business intelligence accessible for growing SMBs with limited technical resources.
Snapshot BI Features
Features
- Drag-and-drop interface for building dashboards
- Pre-built templates and widgets for charts, graphs, and reports
- Data connectors for databases, cloud apps, Excel, etc
- Real-time data updates
- Sharing and scheduling capabilities
- Ad hoc reporting
- Data blending from multiple sources
- Customizable user permissions
- Mobile app for access on the go
Pricing
- Subscription-Based
Pros
Intuitive and easy to use
Affordable pricing
Fast implementation
Great for small to midsize businesses
No coding required
Good customer support
Cons
Limited advanced analytics functionality
Not ideal for large enterprises
Lacks some customization options
Third-party connectors can be hit or miss
Mobile app lacks some features
Official Links
Reviews & Ratings
Login to ReviewThe Best Snapshot BI Alternatives
View all Snapshot BI alternatives with detailed comparison →
Top Business & Commerce and Business Intelligence and other similar apps like Snapshot BI
Here are some alternatives to Snapshot BI:
Suggest an alternative ❐Microsoft Power BI
Microsoft Power BI is a powerful business analytics service developed by Microsoft. It empowers users to transform raw data into meaningful insights, create interactive reports and dashboards, and share data-driven stories within an organization. Power BI is designed to help businesses and individuals make informed decisions based on a comprehensive...

Tableau
Tableau is a leading business intelligence and data visualization platform used by organizations of all sizes to transform their data into easy-to-understand visualizations and dashboards. With Tableau, users can connect to a wide range of data sources, prepare and clean the data for analysis, and create interactive data visualizations such...

JasperReports
JasperReports is an open source Java reporting library that can generate various types of reports from different data sources. It is very flexible and offers many features:Supports connecting to various data sources like SQL databases, NoSQL databases, XML, JSON, CSV files, etc.Can generate reports in multiple formats including PDF, HTML,...

Crystal Reports
Crystal Reports is a flexible business reporting tool used to design and generate professional reports from virtually any data source. Originally created by Crystal Services and now owned by SAP, Crystal Reports has been around since the early 1990s and has become one of the most popular reporting tools used...
SQL Server Reporting Services
SQL Server Reporting Services (SSRS) is a comprehensive enterprise reporting platform from Microsoft that allows users to create and deliver interactive, mobile-ready reports across the organization. SSRS can connect to almost any data source to build rich, interactive reports with charts, maps, sparklines and more.Key features and capabilities of SSRS...

Talend
Talend is an open source data integration and management platform designed to help organizations effectively collect, transform, cleanse and share data across systems and teams. Some key capabilities and benefits of Talend include:Graphical drag-and-drop interface to build data integration jobs and workflows without codingOver 900 pre-built data connectors to leading...
Looker Studio
Looker Studio is a business intelligence and analytics platform designed to help companies analyze data and gain valuable insights. It provides an intuitive, web-based interface that enables users without technical skills to explore, visualize and share data easily.Some key capabilities and benefits of Looker Studio include:Interactive dashboards - Users can...

QlikView
QlikView is a business intelligence and data visualization platform used to create interactive dashboards and analytics applications. It was first released in 1993 by the Swedish company Qlik. Key features of QlikView include:Associative data modeling and in-memory analytics engine - Allows fast analysis of large, disparate datasets without predefined schema...

Pentaho
Pentaho is a comprehensive open source business intelligence (BI) suite that provides a range of data integration, analytics, visualization, reporting, data mining, and workflow capabilities. It is designed to help businesses consolidate data from disparate sources for unified analytics and reporting.Some of the key capabilities and components of Pentaho include:Data...

Hale Studio
Hale Studio is an open source platform for data alignment, transformation, and enrichment. It provides a graphical user interface to manage complex data mappings for various data integration and transformation scenarios.Some key features and capabilities:Supports various data formats like XML, JSON, CSV, databases, etc.Aligns and transforms data models using a...
Amazon QuickSight
Amazon QuickSight is a fast, cloud-powered business intelligence service that makes it easy to build visualizations, perform ad-hoc analysis, and quickly get business insights from your data. Some key features include:Intuitive visual interface that makes it easy to visualize and explore dataBroad data connectivity to connect to data sources like...

KNOWAGE
Knowage is an open-source business intelligence and data analytics platform. It provides a wide range of features for extracting insights from data, including:Interactive dashboards and reports for data visualizationAd-hoc reporting and analysisAdvanced data visualization with charts, graphs, and mapsData mining and OLAP analysisScorecards and KPI managementData integration from multiple sourcesResponsive...
Marple
Marple is an open-source, Markdown-based slide deck tool for creating presentations. It provides a minimalistic editor interface to write slide content in Markdown format, which then gets rendered into an elegant slide deck for presenting.Some key features of Marple:Write slide content in easy-to-read and write Markdown format. Format headings, lists,...

Xplenty
Xplenty is a cloud-based ETL (extract, transform, load) and data integration platform designed to help users effectively prepare and analyze data from diverse sources. Some key features of Xplenty include:Intuitive drag-and-drop interface for building automated data pipelines without codingPre-built integrations with 100+ data sources and destinations like databases, data warehouses,...
Hugo Software
Hugo is an open-source static site generator created by Steve Francia in 2013. It is written in Go programming language and developed on GitHub. Hugo utilizes Markdown for content, has built-in sass/scss support for styling, and is known for its speed and flexibility.Some key features of Hugo include:Extremely fast build...
Keboola Connection
Keboola Connection is a cloud-based data integration and transformation platform designed to help businesses efficiently manage their data pipelines and gain actionable insights. Some key features of Keboola Connection include:Drag-and-drop interface to visually build data workflows and ETL processes without codingPre-built connectors to easily integrate data from various sources like...