Keboola Connection
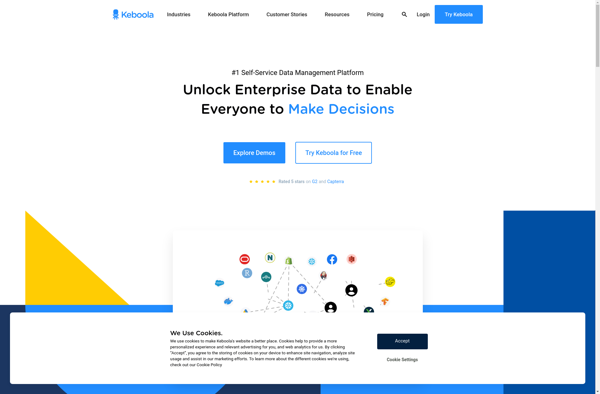
Keboola Connection is a cloud-based data integration platform that allows you to easily connect, transform, and analyze data from various sources. It provides an intuitive drag-and-drop interface to build data pipelines without writing code.
Keboola Connection: Cloud-Based Data Integration Platform
Cloud-based data integration platform allowing users to easily connect, transform and analyze data from various sources with a drag-and-drop interface.
What is Keboola Connection?
Keboola Connection is a cloud-based data integration and transformation platform designed to help businesses efficiently manage their data pipelines and gain actionable insights. Some key features of Keboola Connection include:
- Drag-and-drop interface to visually build data workflows and ETL processes without coding
- Pre-built connectors to easily integrate data from various sources like databases, cloud apps, APIs, etc.
- Tools for data transformation, validation, and manipulation at scale
- Collaborative workspaces allowing different teams to securely access data pipelines
- Options to orchestrate and schedule data integration jobs for automation
- Powerful visualization and business intelligence capabilities to analyze data and create dashboards
- Detailed logging and monitoring of all data jobs for troubleshooting issues
- Robust security, access control, and data encryption capabilities
Keboola Connection enables organizations to simplify their data ops and democratize data access for business users. With an intuitive interface and modular architecture, it removes technical barriers to working with data for both IT and non-IT teams.
Keboola Connection Features
Features
- Drag-and-drop interface for building data pipelines
- Pre-built components for common data sources and transformations
- Orchestration for scheduling and automating workflows
- Transformation code editor for custom scripts and algorithms
- Centralized data catalog for managing schemas and metadata
- Visual data explorer for ad-hoc SQL queries
- REST API and SDKs for developer integration
- Collaboration features for sharing projects and permissions
- Secure data encryption and access controls
Pricing
- Subscription-Based
- Pay-As-You-Go
Pros
Intuitive UI for non-technical users
No coding required for basic workflows
Scales to handle large data volumes
Fast time-to-value compared to custom coding
Broad set of pre-built connectors and transformations
Collaboration friendly for teams
Strong security and governance capabilities
Cons
Can get expensive for large complex projects
Limited customization compared to custom coding
Not as performant as hand-optimized data pipelines
Proprietary platform locks you in
Steep learning curve for advanced features
Limited capabilities for real-time or streaming data
Official Links
Reviews & Ratings
Login to ReviewThe Best Keboola Connection Alternatives
Top Business & Commerce and Data Integration and other similar apps like Keboola Connection
Here are some alternatives to Keboola Connection:
Suggest an alternative ❐Alteryx
Alteryx is a data preparation and analytics software platform designed to make advanced data analytics accessible to any data worker. It provides an end-to-end platform to ingest, prepare, blend, analyze, and visualize data to gain deeper insights faster.Some key capabilities and benefits of Alteryx include:Intuitive drag-and-drop interface to prep and...
Pentaho
Pentaho is a comprehensive open source business intelligence (BI) suite that provides a range of data integration, analytics, visualization, reporting, data mining, and workflow capabilities. It is designed to help businesses consolidate data from disparate sources for unified analytics and reporting.Some of the key capabilities and components of Pentaho include:Data...
Sisense
Sisense is a business intelligence and data analytics software platform designed to help non-technical users prepare, analyze and visualize complex data. Some key features of Sisense include:Intuitive drag-and-drop interface for building interactive dashboards and visualizations like charts, graphs and pivot tables without coding.Ability to connect to wide variety of data...
MicroStrategy Business Intelligence
MicroStrategy is a leading enterprise analytics platform designed to help organizations make data-driven business decisions through advanced visualization and dashboarding capabilities. It serves as a one-stop solution for BI, allowing for data preparation, discovery, reporting, and predictive analytics.Key features of MicroStrategy include:Interactive dashboards and pixel-perfect reports that can be accessed...
EasyMorph
EasyMorph is a versatile data transformation and ETL (extract, transform, load) desktop application used by both technical and non-technical users. It provides a visual, no-code interface for quickly combining, cleaning, and reshaping data from various sources like Excel, CSV files, databases and other applications and loading it into destination files...
SplashBI
SplashBI is a cloud-based business intelligence and data visualization platform designed for small and medium businesses. Some key features of SplashBI include:Intuitive drag-and-drop interface for building interactive dashboards, charts, tables and reportsLibrary of customizable widgets and visualizations including bar, line and pie chartsAutomated report scheduling and distributionReal-time data connectivity to...
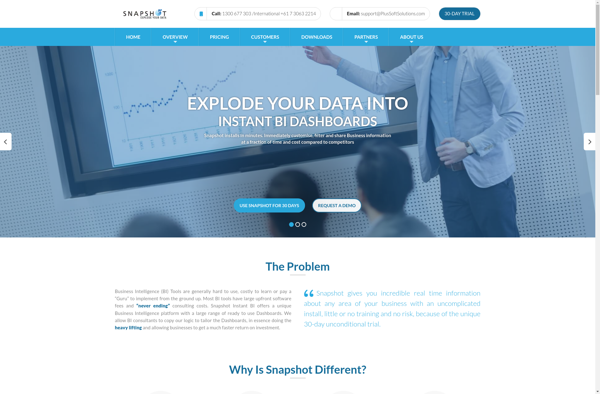
Snapshot BI
Snapshot BI is a business intelligence and analytics software designed specifically for small and medium-sized businesses. It provides an easy-to-use platform for companies to visualize, analyze, and gain actionable insights from their business data.Key features of Snapshot BI include:Interactive dashboards and reports - Create customized dashboards with drag-and-drop widgets to...
Birst
Birst is a cloud-native business intelligence and analytics platform used by enterprises to unify, understand, and act on data. Key capabilities and benefits include:Cloud data warehousing to bring together data from multiple sources for analysisInteractive dashboards and visualizations to spot trends and insightsSelf-service analytics empowering users across the organization to...

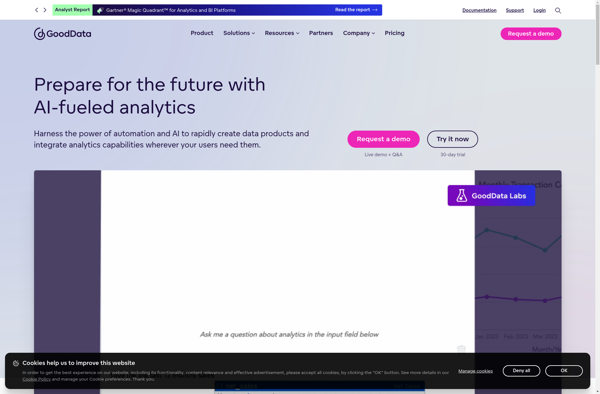
GoodData
GoodData is a business intelligence and analytics platform used by companies to collect, store, and analyze their data to drive business decisions. Some key capabilities and features of GoodData include:Data warehousing and ETL - GoodData ingests data from various sources, transforms it, and loads it into a cloud data warehouse...
Logi Info
Logi Info is a business intelligence and analytics software platform used by organizations to create dashboards, reports, and data visualizations to help analyze data and make better decisions. Some key features and benefits of Logi Info include:Drag-and-drop interface allows non-technical users to access data from various sources like databases, APIs,...
