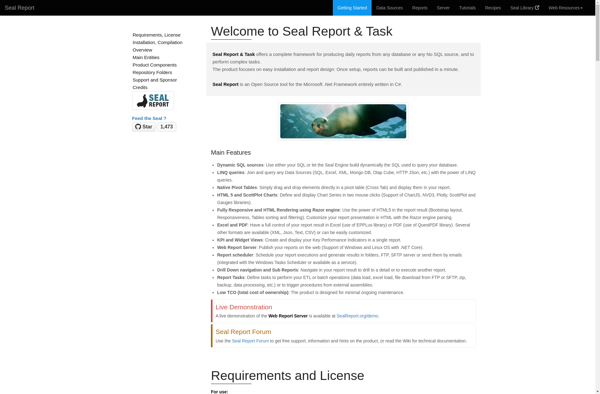
Seal Report is an open source business intelligence and reporting tool. It allows users to easily create dashboards, charts, reports and do data analysis. Useful for small and medium businesses looking for an affordable BI solution.
Seal Report: Open Source Business Intelligence and Reporting Tool
An open source business intelligence and reporting tool, Seal Report allows users to create dashboards, charts, reports and analyze data, providing a cost-effective BI solution for small and medium businesses.
What is Seal Report?
Seal Report is an open source business intelligence and reporting software. It provides an intuitive graphical interface and drag & drop features to easily create interactive dashboards, charts, reports and perform data analysis without needing coding skills.
Key features of Seal Report include:
Connect to multiple data sources like MySQL, PostgreSQL, Microsoft SQL Server, etc.
Drag and drop interface to build reports and dashboards visually
Various chart types like bar, pie, line, scatter plots etc
Filtering, grouping, sorting, formula columns
Schedule and email reports, alerts
User management, access controls
Open source software with active community
Seal Report can be useful for small and medium businesses looking for an open source, cost effective option for their BI and reporting needs. The graphical interface makes it easy for non-technical users to create reports without needing extensive training. It provides good capabilities for interactive analysis and Dashboarding of data.
Microsoft Power BI is a powerful business analytics service developed by Microsoft. It empowers users to transform raw data into meaningful insights, create interactive reports and dashboards, and share data-driven stories within an organization. Power BI is designed to help businesses and individuals make informed decisions based on a comprehensive...
JasperReports is an open source Java reporting library that can generate various types of reports from different data sources. It is very flexible and offers many features:Supports connecting to various data sources like SQL databases, NoSQL databases, XML, JSON, CSV files, etc.Can generate reports in multiple formats including PDF, HTML,...
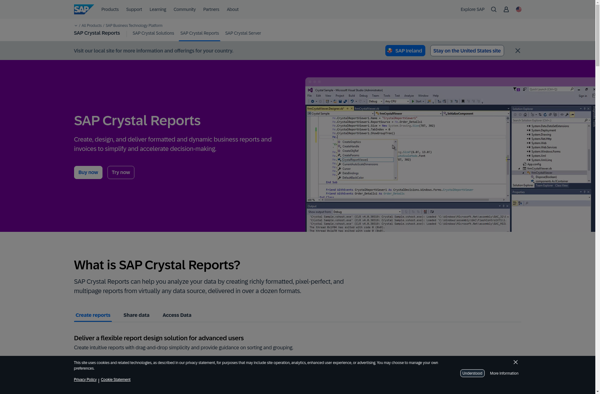
Crystal Reports is a flexible business reporting tool used to design and generate professional reports from virtually any data source. Originally created by Crystal Services and now owned by SAP, Crystal Reports has been around since the early 1990s and has become one of the most popular reporting tools used...
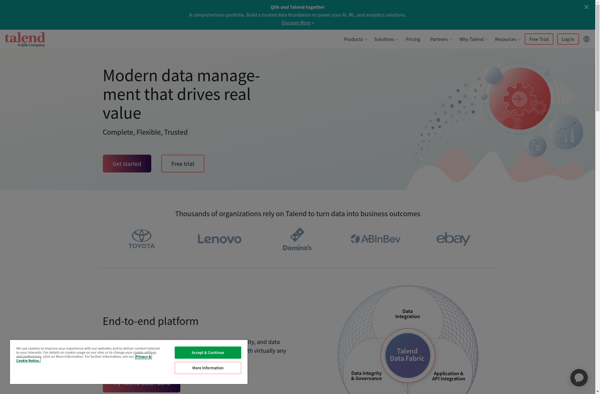
Talend is an open source data integration and management platform designed to help organizations effectively collect, transform, cleanse and share data across systems and teams. Some key capabilities and benefits of Talend include:Graphical drag-and-drop interface to build data integration jobs and workflows without codingOver 900 pre-built data connectors to leading...
Stimulsoft Reports is a flexible business intelligence and reporting tool used to design and generate various types of reports. It provides an intuitive visual report designer for quickly building rich data visualizations and formatted reports.With Stimulsoft, you can connect to a wide variety of data sources including SQL databases, NoSQL...
Valentina Reports is an open-source ad-hoc reporting tool that allows users to create rich visual reports and dashboards from various data sources including SQL & NoSQL databases, Excel, CSV files, Web APIs, and more. It has a graphical drag-and-drop report designer so users can build reports without coding.Key features include:Connectivity...
Colombian Report Designer is a comprehensive reporting solution used to design, manage, and distribute a wide variety of business reports. With its intuitive drag-and-drop interface, users can easily create polished, professional-looking reports without coding.Some key features include:Drag-and-drop report designer with a wide selection of charts, tables, images, and other visual...
DynamicReports is an open-source Java library for creating rich reports and dashboards. It provides a simple API for building complex layouts with tables, charts, images, and more without the need for specialized reporting tools.Some key features of DynamicReports:Runs on Java 8+ so integrates easily into Java web appsCreates PDF, Excel,...
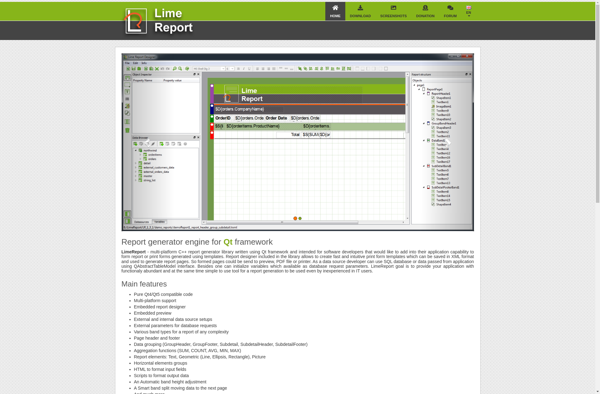
LimeReport is an open-source report generator and rendering engine that allows creating complex reports from various data sources. It is written in C++ and utilizes the Qt framework for the graphical user interface.Some key features and capabilities of LimeReport include:Visual report designer for drag & drop creation of report layouts...
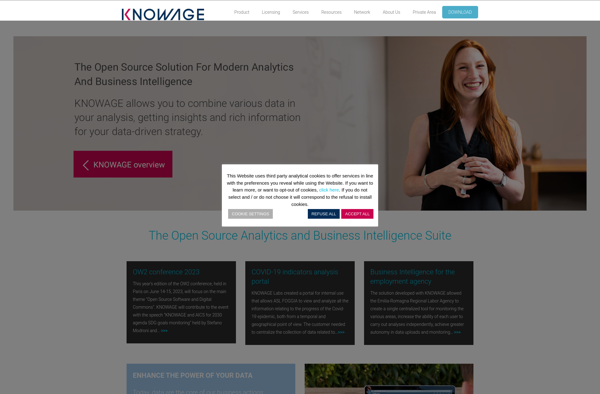
Knowage is an open-source business intelligence and data analytics platform. It provides a wide range of features for extracting insights from data, including:Interactive dashboards and reports for data visualizationAd-hoc reporting and analysisAdvanced data visualization with charts, graphs, and mapsData mining and OLAP analysisScorecards and KPI managementData integration from multiple sourcesResponsive...
SharpDevelop Reports is an open source report designer and generation tool for .NET applications. It provides a visual report builder that allows developers to easily create rich, customizable reports including charts, images, tables, and more without writing code.Some key features of SharpDevelop Reports:Drag and drop report designer for building reports...