SharpDevelop Reports is an open source report builder and designer for .NET applications. It allows developers to easily create rich, customizable reports with charts, images, and more.
SharpDevelop Reports: Open Source Report Builder & Designer for .NET
SharpDevelop Reports is an open source report builder and designer for .NET applications. It allows developers to easily create rich, customizable reports with charts, images, and more.
What is SharpDevelop Reports?
SharpDevelop Reports is an open source report designer and generation tool for .NET applications. It provides a visual report builder that allows developers to easily create rich, customizable reports including charts, images, tables, and more without writing code.
Some key features of SharpDevelop Reports:
Drag and drop report designer for building reports visually
Supports all major data sources including SQL Server, MySQL, PostgreSQL, etc.
Advanced report layout options like headers, footers, grouping, parameters, etc.
Various export formats including PDF, Excel, Word, HTML, images, and more
Extensive charting capabilities with a variety of chart types
Ability to embed images and subreports in reports
Open source library written in C# using .NET Framework
Royalty free distribution and can be embedded into commercial applications
SharpDevelop Reports helps .NET developers save time by providing a powerful WYSIWYG report building tool instead of having to build complex reporting functionality from scratch. Its rich feature set makes it suitable for most reporting needs in business applications.
SharpDevelop Reports Features
Features
Code editor with syntax highlighting and code completion
Integrated debugger
Project templates for various .NET application types
Supports multiple .NET languages like C#, VB.NET, F#
GUI designer
Database explorer
Add-in support to extend functionality
Pricing
Open Source
Pros
Free and open source
Lightweight and fast
Good for .NET development on Windows
Integrates well with Visual Studio
Active community support
Cons
Windows only
Limited IDE features compared to Visual Studio
Not as full-featured as commercial reporting tools
JasperReports is an open source Java reporting library that can generate various types of reports from different data sources. It is very flexible and offers many features:Supports connecting to various data sources like SQL databases, NoSQL databases, XML, JSON, CSV files, etc.Can generate reports in multiple formats including PDF, HTML,...
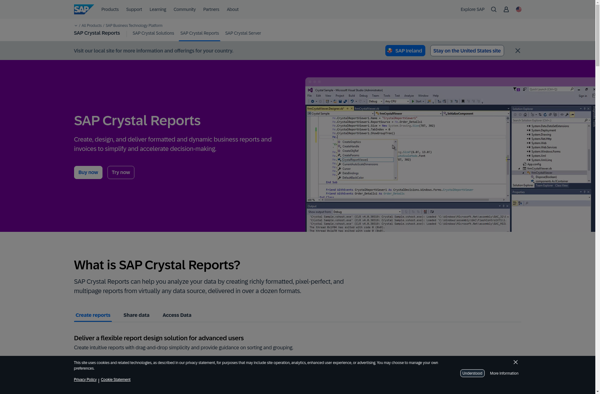
Crystal Reports is a flexible business reporting tool used to design and generate professional reports from virtually any data source. Originally created by Crystal Services and now owned by SAP, Crystal Reports has been around since the early 1990s and has become one of the most popular reporting tools used...
SQL Server Reporting Services (SSRS) is a comprehensive enterprise reporting platform from Microsoft that allows users to create and deliver interactive, mobile-ready reports across the organization. SSRS can connect to almost any data source to build rich, interactive reports with charts, maps, sparklines and more.Key features and capabilities of SSRS...
PHP Report Maker is an open-source PHP library that allows generating PDF and Excel reports from various data sources including MySQL, PostgreSQL, MS SQL, SQLite, Oracle, and CSV files. It provides a simple API for custom report building and formatting using PHP, helping developers and businesses automate business reporting and...
Pentaho is a comprehensive open source business intelligence (BI) suite that provides a range of data integration, analytics, visualization, reporting, data mining, and workflow capabilities. It is designed to help businesses consolidate data from disparate sources for unified analytics and reporting.Some of the key capabilities and components of Pentaho include:Data...
Stimulsoft Reports is a flexible business intelligence and reporting tool used to design and generate various types of reports. It provides an intuitive visual report designer for quickly building rich data visualizations and formatted reports.With Stimulsoft, you can connect to a wide variety of data sources including SQL databases, NoSQL...
ASP.NET Report Maker is an open-source reporting solution for ASP.NET web applications. It provides a drag-and-drop report designer for building rich data reports and dashboards that can be integrated seamlessly into ASP.NET projects.Key features include:Visual report designer for quick report buildingSupport for charts, tables, gauges, maps and other data visualizationsAbility...
Sisense is a business intelligence and data analytics software platform designed to help non-technical users prepare, analyze and visualize complex data. Some key features of Sisense include:Intuitive drag-and-drop interface for building interactive dashboards and visualizations like charts, graphs and pivot tables without coding.Ability to connect to wide variety of data...
FastReport Open Source is a popular open source reporting tool for .NET applications. It enables embedding full-featured reports into desktop, web and mobile applications to display and export data from various data sources into common formats like PDF, Word, Excel, CSV, text, and images.It is free to use and modify...
Valentina Reports is an open-source ad-hoc reporting tool that allows users to create rich visual reports and dashboards from various data sources including SQL & NoSQL databases, Excel, CSV files, Web APIs, and more. It has a graphical drag-and-drop report designer so users can build reports without coding.Key features include:Connectivity...
Colombian Report Designer is a comprehensive reporting solution used to design, manage, and distribute a wide variety of business reports. With its intuitive drag-and-drop interface, users can easily create polished, professional-looking reports without coding.Some key features include:Drag-and-drop report designer with a wide selection of charts, tables, images, and other visual...
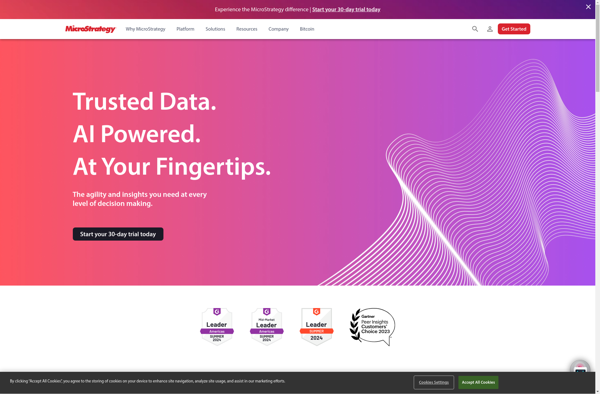
MicroStrategy is a leading enterprise analytics platform designed to help organizations make data-driven business decisions through advanced visualization and dashboarding capabilities. It serves as a one-stop solution for BI, allowing for data preparation, discovery, reporting, and predictive analytics.Key features of MicroStrategy include:Interactive dashboards and pixel-perfect reports that can be accessed...
ART Reporting is a business intelligence and data visualization software used to create interactive reports and dashboards from company data. It provides an easy-to-use interface that allows non-technical users to build reports and visualize data without coding.With drag-and-drop functionality, users can quickly pull data from multiple sources, including SQL databases,...
DynamicReports is an open-source Java library for creating rich reports and dashboards. It provides a simple API for building complex layouts with tables, charts, images, and more without the need for specialized reporting tools.Some key features of DynamicReports:Runs on Java 8+ so integrates easily into Java web appsCreates PDF, Excel,...
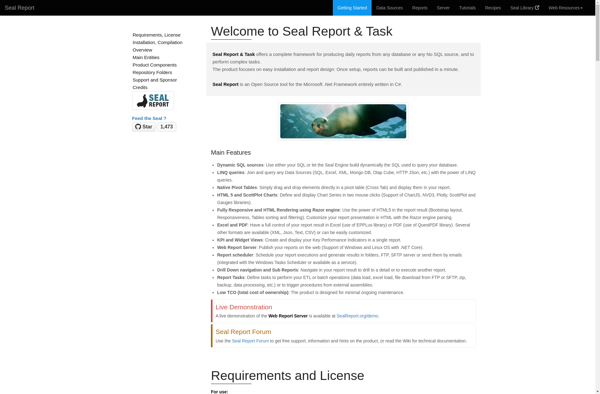
Seal Report is an open source business intelligence and reporting software. It provides an intuitive graphical interface and drag & drop features to easily create interactive dashboards, charts, reports and perform data analysis without needing coding skills.Key features of Seal Report include:Connect to multiple data sources like MySQL, PostgreSQL, Microsoft...
Windward Core is a document generation and reporting engine that can be licensed and integrated into other applications that need advanced document creation and editing capabilities.It provides a full featured template design interface that allows users to easily create complex, data-powered documents without any programming. Templates can include text, images,...
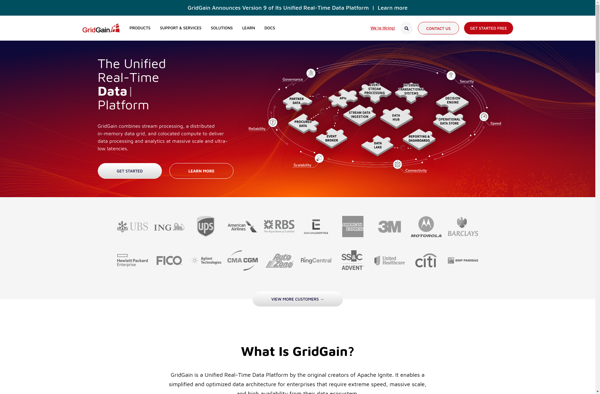
GridGain In-Memory Data Fabric is a distributed in-memory computing platform that enables organizations to develop data-intensive applications that require high performance and massive scalability. It provides an in-memory data grid that can be accessed by applications, allowing them to store and process data with in-memory speeds.Some key capabilities and benefits...
Telerik Reporting is a powerful report generation tool used to create richly formatted reports from a variety of data sources. It offers extensive report authoring capabilities including support for charts, maps, tables, shapes, images and more to build visually compelling and interactive reports.Some key features of Telerik Reporting include:Connect to...
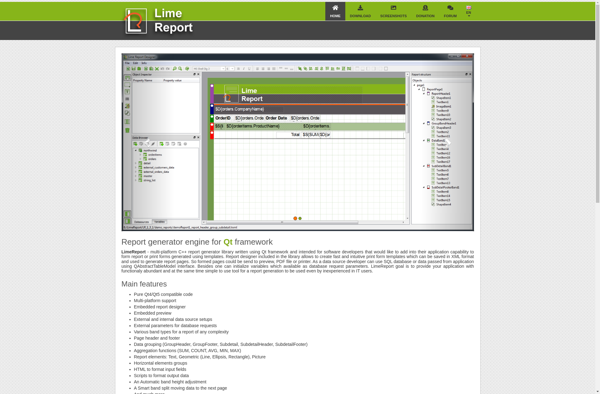
LimeReport is an open-source report generator and rendering engine that allows creating complex reports from various data sources. It is written in C++ and utilizes the Qt framework for the graphical user interface.Some key features and capabilities of LimeReport include:Visual report designer for drag & drop creation of report layouts...
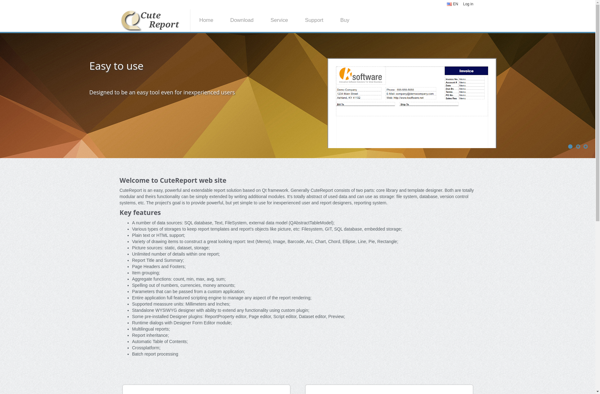
CuteReport is an open-source report creation system written in C++/Qt4. It enables developers to create any kind of reports and integrate them into their applications. The main advantages of CuteReport are:Visual report designer with drag and drop interfaceVarious kinds of diagrams and chartsSupport for multiple data sources: SQL queries, CSV...
LogiXML is a business intelligence and analytics software platform used by organizations to access, analyze, visualize and share data. It allows companies to create interactive dashboards, pixel-perfect reports, and compelling data visualizations that provide actionable insights.Some key features of LogiXML include:Drag-and-drop interface to build reports and dashboards quickly without codingBroad...
DevExpress Reporting (XtraReports) is a feature-rich reporting platform for .NET developers. It allows you to create visually appealing, richly formatted, and printable reports for WinForms, WPF, ASP.NET WebForms, ASP.NET MVC, and ASP.NET Core platforms.Key features of XtraReports include:Intuitive visual designer for building report layouts with bands, labels, shapes, barcodes, and...
KoolReport is an open-source PHP reporting library for faster and easier data reporting. Key features include:Easy and intuitive report creation with minimal codeSupport for variety of data sources: SQL databases, CSV/Excel files, etc.Various chart types including Line, Bar, Pie, Table, Pivot Table, Gauge Chart etc.Interactive reports and dashboardsExport reports to...
myDBR is an intuitive and easy-to-use open-source database modeling and design application. It enables users to visually model database schemas for a variety of database management systems, including MySQL, MariaDB, PostgreSQL, SQLite, SQL Server, and Oracle.With myDBR, users can quickly design and visualize database structures, relationships, and constraints using drag-and-drop...
icStorm is an open-source, self-hosted agile project management application designed for small development teams. It offers similar core functionality as IceScrum, allowing teams to plan and track software projects using agile methodologies like Scrum and kanban.Key features of icStorm include:Customizable kanban boards to visualize workflow and track progressBacklogs for capturing...
SQLwallet is an open-source SQL database engine built with a focus on security, encryption, and privacy. Developed by a team of database experts and cryptographers, SQLwallet aims to make handling confidential user data easier for developers.Some key features of SQLwallet include:End-to-end encryption for data at rest and in transitFine-grained access...
Palo Alto Networks' Palo Suite is an integrated platform that delivers a broad range of cybersecurity capabilities for enterprises. It brings together network security, cloud security, advanced threat prevention, and more into a single offering.At the core of Palo Suite is the company's next-generation firewalls, which provide granular visibility and...