Stimulsoft Reports is a reporting tool that allows you to create, design, and generate reports. It supports various data connections and report output formats. Stimulsoft offers an intuitive visual designer to build reports quickly along with APIs for embedding into applications.
Stimulsoft Reports is a reporting tool that allows you to create, design, and generate reports. It supports various data connections and report output formats. Stimulsoft offers an intuitive visual designer to build reports quickly along with APIs for embedding into applications.
What is Stimulsoft Reports?
Stimulsoft Reports is a flexible business intelligence and reporting tool used to design and generate various types of reports. It provides an intuitive visual report designer for quickly building rich data visualizations and formatted reports.
With Stimulsoft, you can connect to a wide variety of data sources including SQL databases, NoSQL databases, cloud data sources, Excel, CSV files, and more. Robust data processing capabilities allow shaping, filtering, grouping, sorting, and aggregating data as needed.
Highlights and key capabilities of Stimulsoft Reports:
Visually design and build reports via drag-and-drop within the standalone designer application.
Use themes, styles, and appearance settings to customize the look and feel of reports.
Choose from a variety of charts and graphs including bar, line, pie, pivot tables, gauges, and geographic maps.
Add interactivity to reports with parameters, bookmarks, and drill-down capabilities.
Export reports to various file types such as PDF, Excel, Word, and images.
Distribute reports via email, save on disk, or host on web servers.
Embed reporting functionality into .NET, Java, and JavaScript applications.
Available on-premise or in the cloud via SaaS delivery model.
Stimulsoft Reports offers reliable performance for medium and large datasets along with scheduling and delivery options. It ships with samples and documentation to get started quickly.
Stimulsoft Reports Features
Features
Drag-and-drop report designer
Wide range of data connectors
Support for multiple report output formats like PDF, Excel, HTML etc
JasperReports is an open source Java reporting library that can generate various types of reports from different data sources. It is very flexible and offers many features:Supports connecting to various data sources like SQL databases, NoSQL databases, XML, JSON, CSV files, etc.Can generate reports in multiple formats including PDF, HTML,...
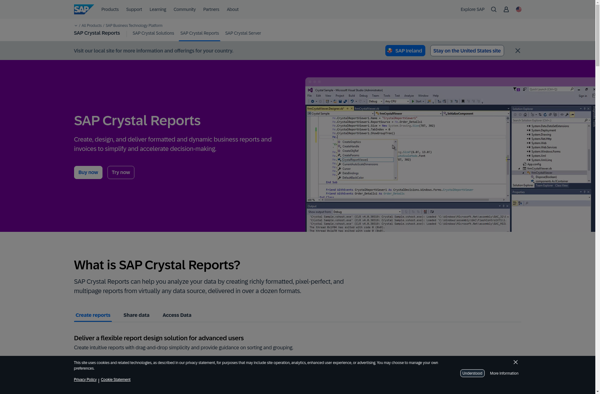
Crystal Reports is a flexible business reporting tool used to design and generate professional reports from virtually any data source. Originally created by Crystal Services and now owned by SAP, Crystal Reports has been around since the early 1990s and has become one of the most popular reporting tools used...
SQL Server Reporting Services (SSRS) is a comprehensive enterprise reporting platform from Microsoft that allows users to create and deliver interactive, mobile-ready reports across the organization. SSRS can connect to almost any data source to build rich, interactive reports with charts, maps, sparklines and more.Key features and capabilities of SSRS...
Pentaho is a comprehensive open source business intelligence (BI) suite that provides a range of data integration, analytics, visualization, reporting, data mining, and workflow capabilities. It is designed to help businesses consolidate data from disparate sources for unified analytics and reporting.Some of the key capabilities and components of Pentaho include:Data...
Sisense is a business intelligence and data analytics software platform designed to help non-technical users prepare, analyze and visualize complex data. Some key features of Sisense include:Intuitive drag-and-drop interface for building interactive dashboards and visualizations like charts, graphs and pivot tables without coding.Ability to connect to wide variety of data...
FastReport Open Source is a popular open source reporting tool for .NET applications. It enables embedding full-featured reports into desktop, web and mobile applications to display and export data from various data sources into common formats like PDF, Word, Excel, CSV, text, and images.It is free to use and modify...
ART Reporting is a business intelligence and data visualization software used to create interactive reports and dashboards from company data. It provides an easy-to-use interface that allows non-technical users to build reports and visualize data without coding.With drag-and-drop functionality, users can quickly pull data from multiple sources, including SQL databases,...
DynamicReports is an open-source Java library for creating rich reports and dashboards. It provides a simple API for building complex layouts with tables, charts, images, and more without the need for specialized reporting tools.Some key features of DynamicReports:Runs on Java 8+ so integrates easily into Java web appsCreates PDF, Excel,...
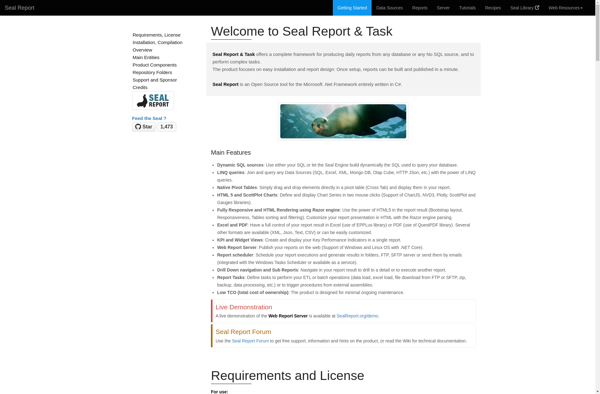
Seal Report is an open source business intelligence and reporting software. It provides an intuitive graphical interface and drag & drop features to easily create interactive dashboards, charts, reports and perform data analysis without needing coding skills.Key features of Seal Report include:Connect to multiple data sources like MySQL, PostgreSQL, Microsoft...
Windward Core is a document generation and reporting engine that can be licensed and integrated into other applications that need advanced document creation and editing capabilities.It provides a full featured template design interface that allows users to easily create complex, data-powered documents without any programming. Templates can include text, images,...
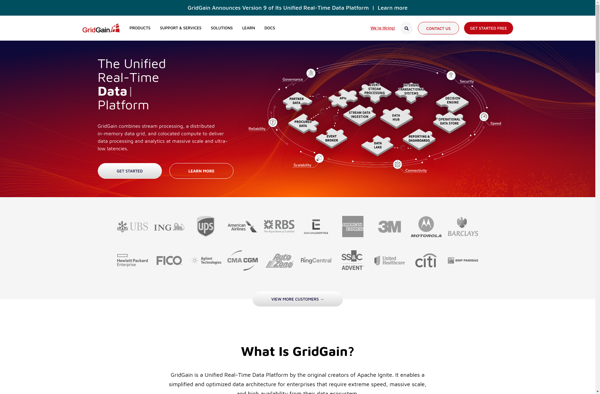
GridGain In-Memory Data Fabric is a distributed in-memory computing platform that enables organizations to develop data-intensive applications that require high performance and massive scalability. It provides an in-memory data grid that can be accessed by applications, allowing them to store and process data with in-memory speeds.Some key capabilities and benefits...
Telerik Reporting is a powerful report generation tool used to create richly formatted reports from a variety of data sources. It offers extensive report authoring capabilities including support for charts, maps, tables, shapes, images and more to build visually compelling and interactive reports.Some key features of Telerik Reporting include:Connect to...
SharpDevelop Reports is an open source report designer and generation tool for .NET applications. It provides a visual report builder that allows developers to easily create rich, customizable reports including charts, images, tables, and more without writing code.Some key features of SharpDevelop Reports:Drag and drop report designer for building reports...