icStorm

IcStorm

icStorm is an open-source, self-hosted alternative to IceScrum. It is a project management and agile software development tool aimed at small teams, with features including kanban boards, sprint planning, backlogs, reports, and integrations.
icStorm image
kanban agile project-management selfhosted

icStorm: Open-Source Kanban & Agile Project Management Tool

A self-hosted alternative to IceScrum, icStorm offers kanban boards, sprint planning, backlogs, reports, and integrations for small teams.

What is IcStorm?

icStorm is an open-source, self-hosted agile project management application designed for small development teams. It offers similar core functionality as IceScrum, allowing teams to plan and track software projects using agile methodologies like Scrum and kanban.

Key features of icStorm include:

  • Customizable kanban boards to visualize workflow and track progress
  • Backlogs for capturing and prioritizing user stories and requirements
  • Sprint planning tools for time-boxing work into iterations
  • Task assignment and tracking development activity
  • Burndown charts and reports for monitoring performance
  • Lightweight and easy to self-host for small teams
  • Open API and integrations with tools like version control, CI, chat, etc.

As an open-source IceScrum alternative, icStorm focuses squarely on core agile project management capabilities for small teams. It allows customizing workflows to Scrum or kanban approaches. Overall, icStorm delivers capable free and self-hosted solutions for beginners practicing agile software development.

IcStorm Features

Features

  1. Kanban boards
  2. Sprint planning
  3. Backlogs
  4. Reports
  5. Integrations

Pricing

  • Open Source
  • Free

Pros

Open source

Self-hosted

Free

Customizable

Cons

Limited features compared to paid tools

Requires self-hosting infrastructure

Limited integrations


The Best IcStorm Alternatives

Top Development and Project Management and other similar apps like IcStorm


Microsoft Power BI icon

Microsoft Power BI

Microsoft Power BI is a powerful business analytics service developed by Microsoft. It empowers users to transform raw data into meaningful insights, create interactive reports and dashboards, and share data-driven stories within an organization. Power BI is designed to help businesses and individuals make informed decisions based on a comprehensive...
Microsoft Power BI image
JasperReports icon

JasperReports

JasperReports is an open source Java reporting library that can generate various types of reports from different data sources. It is very flexible and offers many features:Supports connecting to various data sources like SQL databases, NoSQL databases, XML, JSON, CSV files, etc.Can generate reports in multiple formats including PDF, HTML,...
JasperReports image
Crystal Reports icon

Crystal Reports

Crystal Reports is a flexible business reporting tool used to design and generate professional reports from virtually any data source. Originally created by Crystal Services and now owned by SAP, Crystal Reports has been around since the early 1990s and has become one of the most popular reporting tools used...
Crystal Reports image
SQL Server Reporting Services icon

SQL Server Reporting Services

SQL Server Reporting Services (SSRS) is a comprehensive enterprise reporting platform from Microsoft that allows users to create and deliver interactive, mobile-ready reports across the organization. SSRS can connect to almost any data source to build rich, interactive reports with charts, maps, sparklines and more.Key features and capabilities of SSRS...
SQL Server Reporting Services image
Talend icon

Talend

Talend is an open source data integration and management platform designed to help organizations effectively collect, transform, cleanse and share data across systems and teams. Some key capabilities and benefits of Talend include:Graphical drag-and-drop interface to build data integration jobs and workflows without codingOver 900 pre-built data connectors to leading...
Talend image
QlikView icon

QlikView

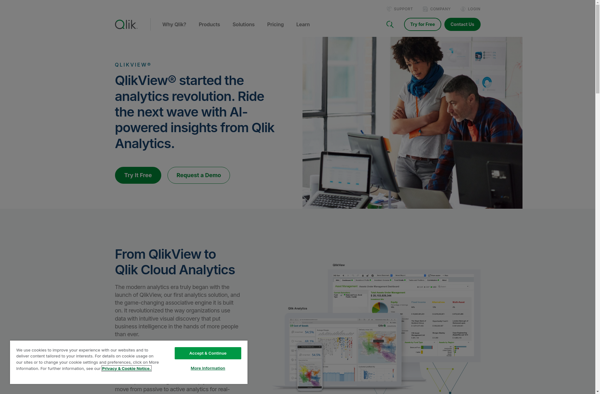
QlikView is a business intelligence and data visualization platform used to create interactive dashboards and analytics applications. It was first released in 1993 by the Swedish company Qlik. Key features of QlikView include:Associative data modeling and in-memory analytics engine - Allows fast analysis of large, disparate datasets without predefined schema...
QlikView image
Pentaho icon

Pentaho

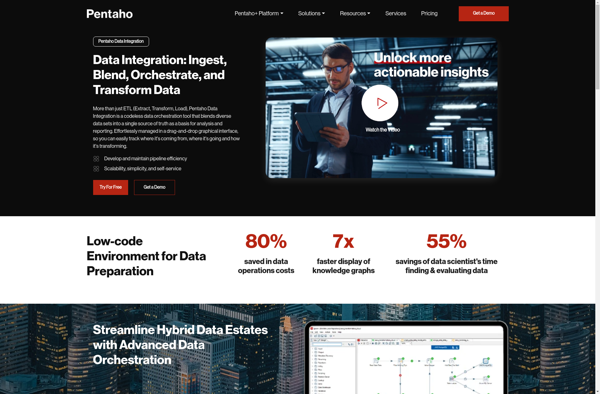
Pentaho is a comprehensive open source business intelligence (BI) suite that provides a range of data integration, analytics, visualization, reporting, data mining, and workflow capabilities. It is designed to help businesses consolidate data from disparate sources for unified analytics and reporting.Some of the key capabilities and components of Pentaho include:Data...
Pentaho image
Sisense icon

Sisense

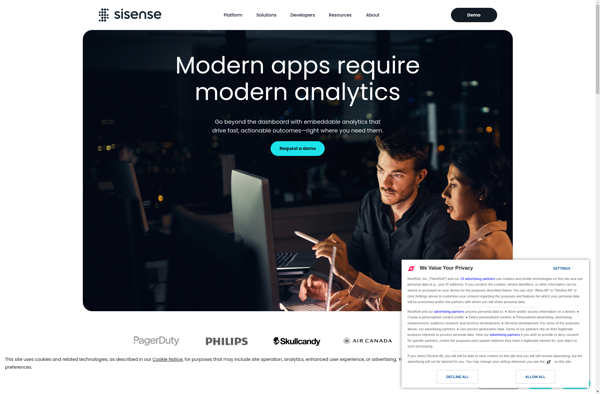
Sisense is a business intelligence and data analytics software platform designed to help non-technical users prepare, analyze and visualize complex data. Some key features of Sisense include:Intuitive drag-and-drop interface for building interactive dashboards and visualizations like charts, graphs and pivot tables without coding.Ability to connect to wide variety of data...
Sisense image
Windward Core - Document Generation Component icon
Windward Core - Document Generation Component

Windward Core is a document generation and reporting engine that can be licensed and integrated into other applications that need advanced document creation and editing capabilities.It provides a full featured template design interface that allows users to easily create complex, data-powered documents without any programming. Templates can include text, images,...
Windward Core - Document Generation Component image
GridGain In-Memory Data Fabric icon

GridGain In-Memory Data Fabric

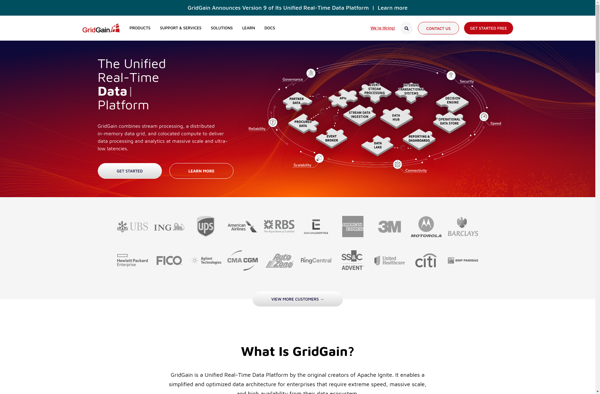
GridGain In-Memory Data Fabric is a distributed in-memory computing platform that enables organizations to develop data-intensive applications that require high performance and massive scalability. It provides an in-memory data grid that can be accessed by applications, allowing them to store and process data with in-memory speeds.Some key capabilities and benefits...
GridGain In-Memory Data Fabric image
Telerik Reporting icon

Telerik Reporting

Telerik Reporting is a powerful report generation tool used to create richly formatted reports from a variety of data sources. It offers extensive report authoring capabilities including support for charts, maps, tables, shapes, images and more to build visually compelling and interactive reports.Some key features of Telerik Reporting include:Connect to...
Telerik Reporting image
SharpDevelop Reports icon

SharpDevelop Reports

SharpDevelop Reports is an open source report designer and generation tool for .NET applications. It provides a visual report builder that allows developers to easily create rich, customizable reports including charts, images, tables, and more without writing code.Some key features of SharpDevelop Reports:Drag and drop report designer for building reports...
SharpDevelop Reports image