SpagoBI
SpagoBI is an open source business intelligence and data visualization platform. It allows users to create interactive dashboards, reports, and analytics from various data sources. SpagoBI supports real-time data analysis and collaboration.
SpagoBI: Open Source Business Intelligence Platform
Create interactive dashboards, reports, and analytics with real-time data analysis and collaboration features.
What is SpagoBI?
SpagoBI is an open-source business intelligence (BI) suite that provides a wide range of analytical and reporting capabilities for data analysis and visualization. It allows organizations to build interactive dashboards, reports, charts, widgets and what-if analysis to get valuable insights from their data.
Some of the key features of SpagoBI include:
- Interactive dashboards with drag-and-drop interface for business users
- Ad-hoc reporting to empower users to analyze data independently without relying on IT teams
- Advanced data visualization including charts, tables, pivot tables, maps and more
- Self-service analytics capabilities for business users
- Support for real-time data analysis and monitoring
- Collaboration features to share reports, insights and annotations
- Pre-built templates, widgets and themes for reports and dashboards
- Scheduling and distribution of reports via email and portals
- Integration with big data platforms like Hadoop, data warehouses, OLAP servers and more
- Web-based interface with support for responsive UIs usable on desktop and mobile
Overall, SpagoBI offers a flexible, scalable and feature-rich platform to unlock analytics across various data sources and make data-driven decisions faster.
SpagoBI Features
Features
- Interactive dashboards
- Ad-hoc reporting
- OLAP analysis
- Geo-spatial analytics
- Data mining
- ETL capabilities
- Metadata management
- Schedule and distribute reports
- Mobile app for analytics
- Integration with R and Python
Pricing
- Open Source
Pros
Open source and free
Highly customizable and extensible
Supports wide range of data sources
Powerful ETL and data integration
Can be deployed on-premise or in the cloud
Cons
Steep learning curve
Limited pre-built content and visualizations
Not as user friendly as some commercial BI tools
Lacks some advanced analytics capabilities
Official Links
Reviews & Ratings
Login to ReviewThe Best SpagoBI Alternatives
View all SpagoBI alternatives with detailed comparison →
Top Business & Commerce and Business Intelligence & Analytics and other similar apps like SpagoBI
Here are some alternatives to SpagoBI:
Suggest an alternative ❐Microsoft Power BI
Microsoft Power BI is a powerful business analytics service developed by Microsoft. It empowers users to transform raw data into meaningful insights, create interactive reports and dashboards, and share data-driven stories within an organization. Power BI is designed to help businesses and individuals make informed decisions based on a comprehensive...

JasperReports
JasperReports is an open source Java reporting library that can generate various types of reports from different data sources. It is very flexible and offers many features:Supports connecting to various data sources like SQL databases, NoSQL databases, XML, JSON, CSV files, etc.Can generate reports in multiple formats including PDF, HTML,...

SQL Server Reporting Services
SQL Server Reporting Services (SSRS) is a comprehensive enterprise reporting platform from Microsoft that allows users to create and deliver interactive, mobile-ready reports across the organization. SSRS can connect to almost any data source to build rich, interactive reports with charts, maps, sparklines and more.Key features and capabilities of SSRS...

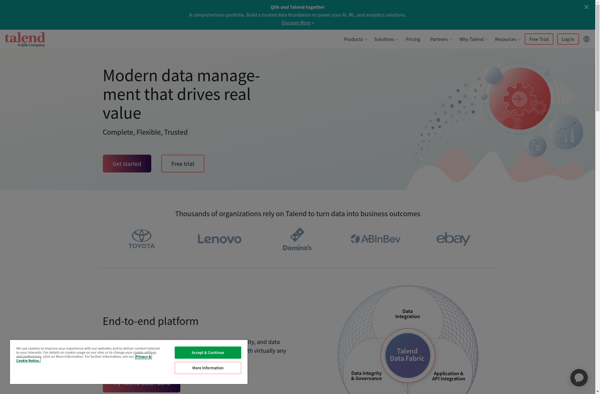
Talend
Talend is an open source data integration and management platform designed to help organizations effectively collect, transform, cleanse and share data across systems and teams. Some key capabilities and benefits of Talend include:Graphical drag-and-drop interface to build data integration jobs and workflows without codingOver 900 pre-built data connectors to leading...
QlikView
QlikView is a business intelligence and data visualization platform used to create interactive dashboards and analytics applications. It was first released in 1993 by the Swedish company Qlik. Key features of QlikView include:Associative data modeling and in-memory analytics engine - Allows fast analysis of large, disparate datasets without predefined schema...

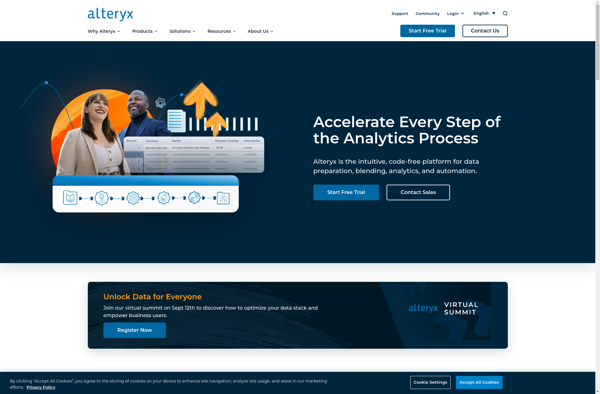
Alteryx
Alteryx is a data preparation and analytics software platform designed to make advanced data analytics accessible to any data worker. It provides an end-to-end platform to ingest, prepare, blend, analyze, and visualize data to gain deeper insights faster.Some key capabilities and benefits of Alteryx include:Intuitive drag-and-drop interface to prep and...
Pentaho
Pentaho is a comprehensive open source business intelligence (BI) suite that provides a range of data integration, analytics, visualization, reporting, data mining, and workflow capabilities. It is designed to help businesses consolidate data from disparate sources for unified analytics and reporting.Some of the key capabilities and components of Pentaho include:Data...

Sisense
Sisense is a business intelligence and data analytics software platform designed to help non-technical users prepare, analyze and visualize complex data. Some key features of Sisense include:Intuitive drag-and-drop interface for building interactive dashboards and visualizations like charts, graphs and pivot tables without coding.Ability to connect to wide variety of data...

LinceBI
LinceBI is an open-source business intelligence and data visualization platform used to analyze and visualize data for better business insights. It provides an intuitive drag-and-drop interface to create interactive dashboards, reports, charts and graphs without the need for coding.Some key features of LinceBI include:Connectivity to multiple data sources such as...
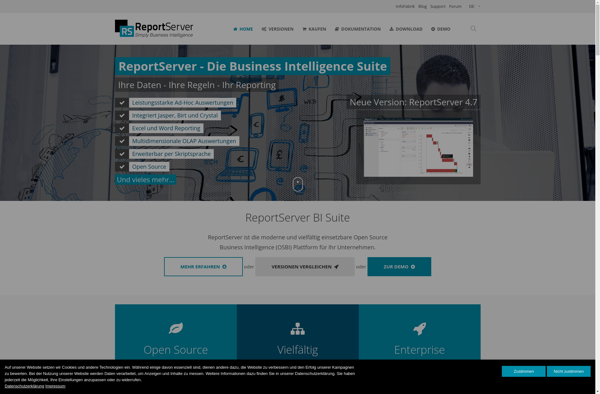
ReportServer
ReportServer is an open source business intelligence and reporting platform used to create and distribute interactive reports and dashboards. It supports connecting to various relational and NoSQL databases, flat files, REST APIs, and other data sources to build reports.Some key capabilities and benefits of ReportServer include:Ad-hoc reporting for business users...