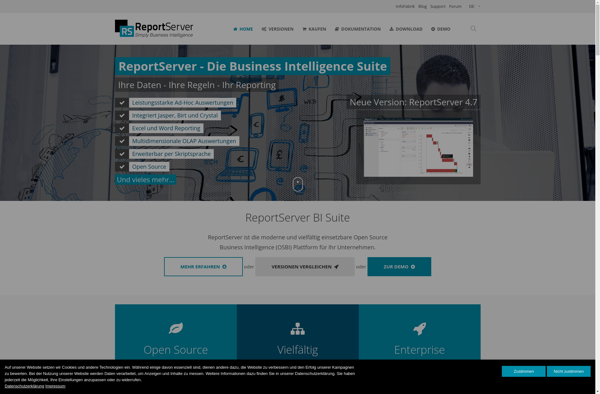
ReportServer is an open source business intelligence and reporting tool. It allows users to create interactive reports and dashboards from various data sources. Key features include ad-hoc reporting, scheduling, export options, and access control.
ReportServer: Open Source Business Intelligence and Reporting Tool
ReportServer is an open source business intelligence and reporting tool. It allows users to create interactive reports and dashboards from various data sources. Key features include ad-hoc reporting, scheduling, export options, and access control.
What is ReportServer?
ReportServer is an open source business intelligence and reporting platform used to create and distribute interactive reports and dashboards. It supports connecting to various relational and NoSQL databases, flat files, REST APIs, and other data sources to build reports.
Some key capabilities and benefits of ReportServer include:
Ad-hoc reporting for business users to analyze data and create reports without IT involvement
Interactive dashboards with charts, tables, maps, and other visualizations
Scheduling and distribution options for automated report delivery via email, portals, etc.
Export reports to PDF, Excel, CSV and other formats
Access control to manage user permissions and data access
Customizable reporting through adding JavaScript and CSS
Integration with LDAP/Active Directory for access management
Available on both Linux and Windows platforms
Can be deployed on-premises or in the cloud
ReportServer provides an enterprise-ready, scalable reporting solution while being cost-effective compared to proprietary BI tools. Its open source nature also allows for custom enhancements and integration with other apps.
ReportServer Features
Features
Ad-hoc reporting
Interactive dashboards
Scheduling and delivery
Export to PDF, Excel, CSV
Access control and security
Customizable themes
Data visualization
OLAP integration
REST API
Pricing
Open Source
Pros
Free and open source
Easy to use and learn
Connects to many data sources
Good community support
Highly customizable
Self-hosted on-premises deployment
Cons
Limited built-in charts compared to proprietary BI tools
JasperReports is an open source Java reporting library that can generate various types of reports from different data sources. It is very flexible and offers many features:Supports connecting to various data sources like SQL databases, NoSQL databases, XML, JSON, CSV files, etc.Can generate reports in multiple formats including PDF, HTML,...
SQL Server Reporting Services (SSRS) is a comprehensive enterprise reporting platform from Microsoft that allows users to create and deliver interactive, mobile-ready reports across the organization. SSRS can connect to almost any data source to build rich, interactive reports with charts, maps, sparklines and more.Key features and capabilities of SSRS...
QlikView is a business intelligence and data visualization platform used to create interactive dashboards and analytics applications. It was first released in 1993 by the Swedish company Qlik. Key features of QlikView include:Associative data modeling and in-memory analytics engine - Allows fast analysis of large, disparate datasets without predefined schema...
Pentaho is a comprehensive open source business intelligence (BI) suite that provides a range of data integration, analytics, visualization, reporting, data mining, and workflow capabilities. It is designed to help businesses consolidate data from disparate sources for unified analytics and reporting.Some of the key capabilities and components of Pentaho include:Data...
Sisense is a business intelligence and data analytics software platform designed to help non-technical users prepare, analyze and visualize complex data. Some key features of Sisense include:Intuitive drag-and-drop interface for building interactive dashboards and visualizations like charts, graphs and pivot tables without coding.Ability to connect to wide variety of data...
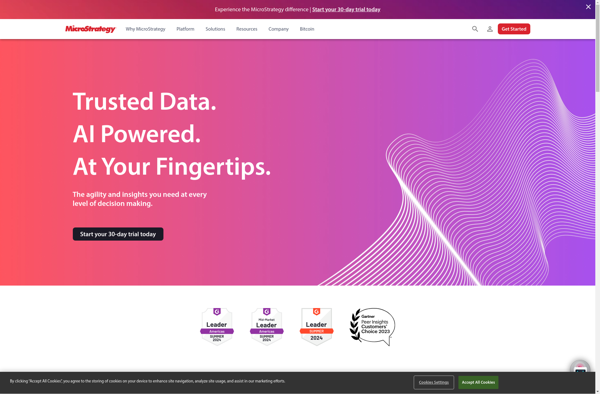
MicroStrategy is a leading enterprise analytics platform designed to help organizations make data-driven business decisions through advanced visualization and dashboarding capabilities. It serves as a one-stop solution for BI, allowing for data preparation, discovery, reporting, and predictive analytics.Key features of MicroStrategy include:Interactive dashboards and pixel-perfect reports that can be accessed...
ART Reporting is a business intelligence and data visualization software used to create interactive reports and dashboards from company data. It provides an easy-to-use interface that allows non-technical users to build reports and visualize data without coding.With drag-and-drop functionality, users can quickly pull data from multiple sources, including SQL databases,...
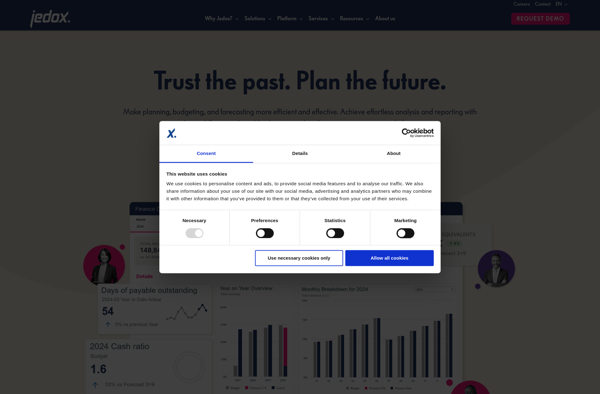
Jedox is a comprehensive business intelligence and corporate performance management platform designed for mid-size to large enterprises. It provides a wide range of capabilities including:Multi-dimensional online analytical processing (OLAP) for complex data analysis and modelingPlanning, budgeting, and forecasting features for financial planning and simulationCustomizable dashboards and self-service reporting for business...
QueryTree is a visual SQL analytics software designed to make query building fast and easy for any skill level. It features an intuitive drag-and-drop interface that allows users to construct complex SQL queries visually without typing code.Some key features of QueryTree include:Visual query builder with drag-and-drop fields and quick type...
SpagoBI is an open-source business intelligence (BI) suite that provides a wide range of analytical and reporting capabilities for data analysis and visualization. It allows organizations to build interactive dashboards, reports, charts, widgets and what-if analysis to get valuable insights from their data.Some of the key features of SpagoBI include:Interactive...
Parrily is a cloud-based project management and team collaboration software designed specifically for agile development teams. It provides a variety of features to help manage projects, track progress, and facilitate teamwork:- Kanban boards - Visualize tasks and user stories on digital kanban boards. Move items through defined workflows to track...
KiniMetrix is a cloud-based software platform designed for healthcare providers to help them better manage their practices, engage with patients, gain population health insights, and handle administrative tasks. It combines features typically found in separate electronic health record (EHR), practice management, patient portal and business intelligence solutions into one unified...
Analyza is a business intelligence and data analytics software platform designed to help companies make data-driven decisions. It provides tools for data preparation, interactive visualization, dashboarding, reporting, and predictive analytics.Key features of Analyza include:Intuitive drag-and-drop interface for building dashboards and reports without codingHundreds of customizable data visualization options including charts,...
SQLwallet is an open-source SQL database engine built with a focus on security, encryption, and privacy. Developed by a team of database experts and cryptographers, SQLwallet aims to make handling confidential user data easier for developers.Some key features of SQLwallet include:End-to-end encryption for data at rest and in transitFine-grained access...
Palo Alto Networks' Palo Suite is an integrated platform that delivers a broad range of cybersecurity capabilities for enterprises. It brings together network security, cloud security, advanced threat prevention, and more into a single offering.At the core of Palo Suite is the company's next-generation firewalls, which provide granular visibility and...