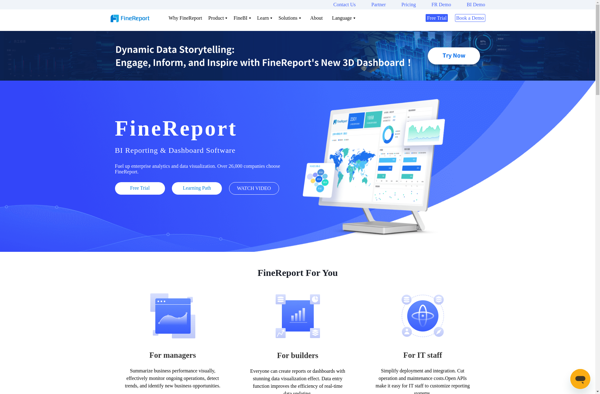
FineReport is a business intelligence and reporting software that allows users to create interactive reports, dashboards, and data visualizations. It has drag-and-drop functionality for report building along with robust scheduling, distribution, and collaboration features.
FineReport: Business Intelligence Reporting Software
FineReport is a business intelligence and reporting software that allows users to create interactive reports, dashboards, and data visualizations. It has drag-and-drop functionality for report building along with robust scheduling, distribution, and collaboration features.
What is FineReport?
FineReport is a business intelligence and reporting solution developed by FineReport Software Co., Ltd. It provides an intuitive drag-and-drop interface for report design, allowing users to easily create interactive and visually engaging reports, dashboards, and data visualizations.
Some key features of FineReport include:
Connectivity to a wide range of data sources like relational databases, cloud applications, big data platforms, and more
Drag-and-drop report builder with a library of customizable charts, tables, gauges and maps
Pixel-perfect formatting for printed outputs including invoices, statements and letters
Interactive dashboards with drill-down capabilities
Scheduling and distribution options for automated report delivery
Built-in collaboration tools for annotation, discussions and approvals
Portals for report consumers to interact with reports and analyze data
APIs and SDK for customization and embedding into other applications
On-premises and cloud deployment options available
With its user-friendly interface, comprehensive features and flexible delivery modes, FineReport is an enterprise-ready reporting solution suitable for companies across industries who want to make data-driven decisions.
Microsoft Power BI is a powerful business analytics service developed by Microsoft. It empowers users to transform raw data into meaningful insights, create interactive reports and dashboards, and share data-driven stories within an organization. Power BI is designed to help businesses and individuals make informed decisions based on a comprehensive...
Tableau is a leading business intelligence and data visualization platform used by organizations of all sizes to transform their data into easy-to-understand visualizations and dashboards. With Tableau, users can connect to a wide range of data sources, prepare and clean the data for analysis, and create interactive data visualizations such...
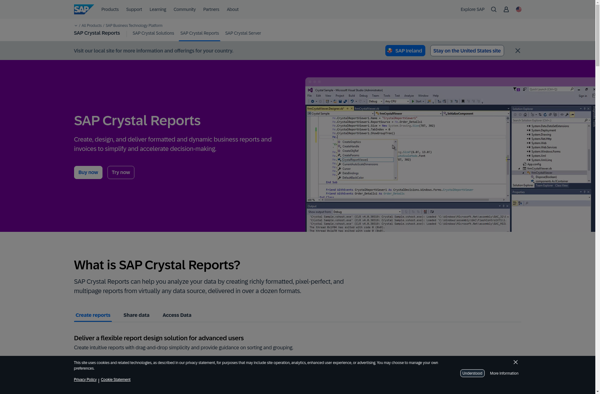
Crystal Reports is a flexible business reporting tool used to design and generate professional reports from virtually any data source. Originally created by Crystal Services and now owned by SAP, Crystal Reports has been around since the early 1990s and has become one of the most popular reporting tools used...
QlikView is a business intelligence and data visualization platform used to create interactive dashboards and analytics applications. It was first released in 1993 by the Swedish company Qlik. Key features of QlikView include:Associative data modeling and in-memory analytics engine - Allows fast analysis of large, disparate datasets without predefined schema...
AnswerMiner is an artificial intelligence-powered software that helps companies improve their customer support operations and experiences. It analyzes large volumes of customer service conversation data, including emails, chat transcripts, and call center notes, to provide actionable insights.The key features and benefits of AnswerMiner include:Understanding Frequent Customer Questions and Pain Points:...
Valentina Reports is an open-source ad-hoc reporting tool that allows users to create rich visual reports and dashboards from various data sources including SQL & NoSQL databases, Excel, CSV files, Web APIs, and more. It has a graphical drag-and-drop report designer so users can build reports without coding.Key features include:Connectivity...
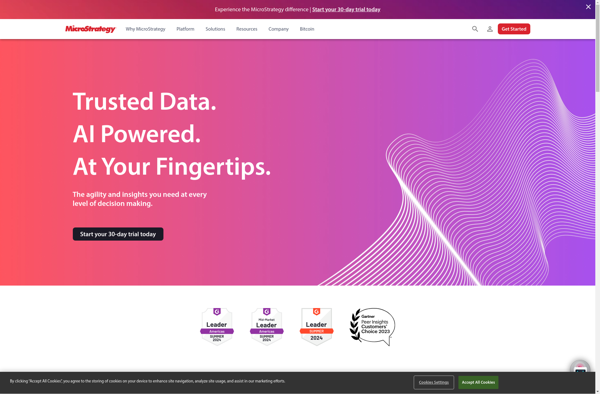
MicroStrategy is a leading enterprise analytics platform designed to help organizations make data-driven business decisions through advanced visualization and dashboarding capabilities. It serves as a one-stop solution for BI, allowing for data preparation, discovery, reporting, and predictive analytics.Key features of MicroStrategy include:Interactive dashboards and pixel-perfect reports that can be accessed...
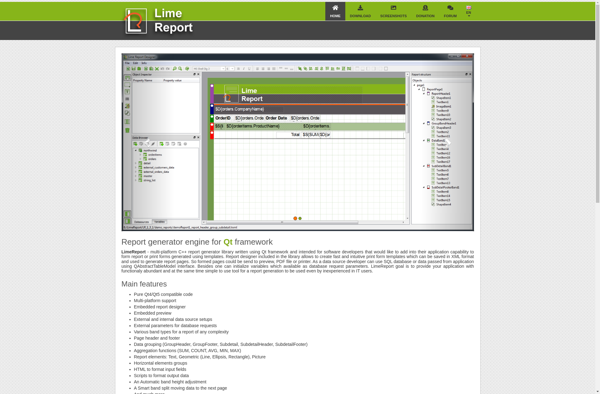
LimeReport is an open-source report generator and rendering engine that allows creating complex reports from various data sources. It is written in C++ and utilizes the Qt framework for the graphical user interface.Some key features and capabilities of LimeReport include:Visual report designer for drag & drop creation of report layouts...
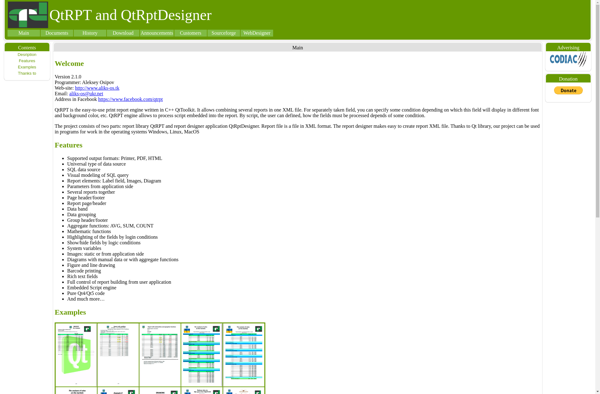
QtRPT / QtRptDesigner is an open-source report generator application designed for use with Qt. It allows developers to create report templates visually by dragging and dropping report elements such as text, images, charts etc. The reports can then be integrated into Qt applications by linking the QtRPT library.Key features of...
Marple is an open-source, Markdown-based slide deck tool for creating presentations. It provides a minimalistic editor interface to write slide content in Markdown format, which then gets rendered into an elegant slide deck for presenting.Some key features of Marple:Write slide content in easy-to-read and write Markdown format. Format headings, lists,...
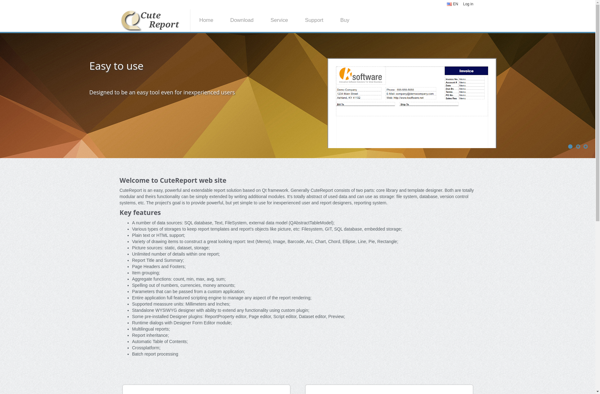
CuteReport is an open-source report creation system written in C++/Qt4. It enables developers to create any kind of reports and integrate them into their applications. The main advantages of CuteReport are:Visual report designer with drag and drop interfaceVarious kinds of diagrams and chartsSupport for multiple data sources: SQL queries, CSV...