Roambi is a business intelligence and data visualization software used to create reports, dashboards, and analytics. It allows you to connect to multiple data sources and visualize data in interactive charts and graphs.
Roambi: Business Intelligence & Data Visualization Softwares
Business intelligence and data visualization software for creating reports, dashboards, and analytics, connecting to multiple data sources with interactive charts and graphs.
What is Roambi?
Roambi is a business intelligence and data visualization platform designed to help companies gain insights from their data. It enables users to consolidate data from multiple sources, analyze it visually, and create interactive dashboards and reports that can be accessed on mobile devices.
Some key features of Roambi include:
Data connectivity - Connect to common data sources like SQL databases, cloud apps, and Excel files to import data.
Data modeling - Shape and transform data to prepare it for analysis.
Visualizations - Create charts, graphs, and maps to spot trends and outliers.
Dashboards - Design interactive dashboards with filters and drill-downs for business users.
Publishing - Securely distribute reports and analytics via mobile devices, portals or embedded inside other apps.
Collaboration - Annotate, discuss insights and share analytics.
Roambi empowers companies to make data-driven decisions by democratizing access to business data across the organizations. With its intuitive drag-and-drop interface, it makes BI accessible to non-technical users as well. It scales across companies of all sizes across various industries.
Sisense is a business intelligence and data analytics software platform designed to help non-technical users prepare, analyze and visualize complex data. Some key features of Sisense include:Intuitive drag-and-drop interface for building interactive dashboards and visualizations like charts, graphs and pivot tables without coding.Ability to connect to wide variety of data...
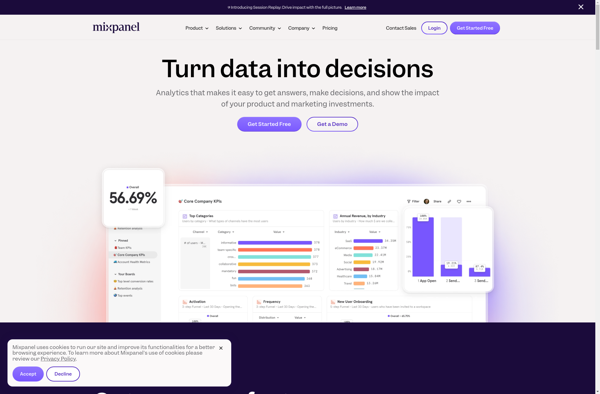
Mixpanel is a robust analytics platform used to analyze user engagement and behavior on websites, mobile apps, and other digital platforms. It provides key insights into audiences and user journeys by tracking actions taken on web and app interfaces, including clicks, taps, form submissions, transactions, media interactions, and more.Unlike basic...
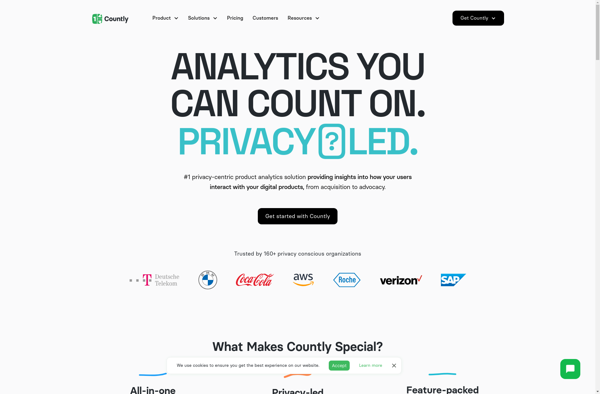
Countly is an open source web and mobile analytics platform used to track and report on user behavior in applications. It provides insightful data to help developers and product managers understand how users are engaging with their apps and websites.Some of the key features of Countly include:Tracking sessions, page views,...
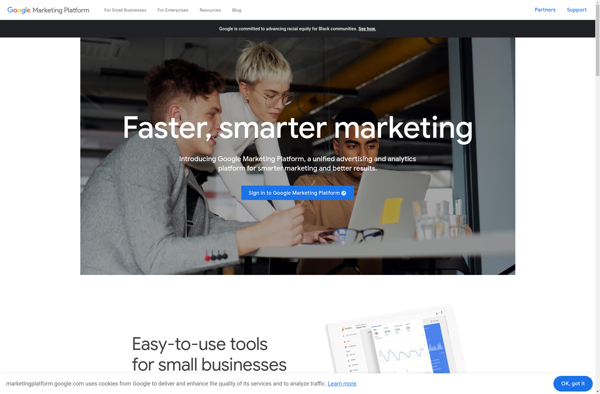
Google Analytics Mobile is a free mobile app from Google that allows users to view real-time analytics for their websites and apps from their mobile devices. It connects to users' Google Analytics accounts to provide on-the-go access to key metrics and reports.Some of the key features of Google Analytics Mobile...
Momentum.link is a browser extension available for Chrome, Firefox, Edge, and Opera that replaces boring new tab pages with a personalized dashboard to boost productivity and inspiration.Key features of Momentum include:To-do list to track tasks and goalsWeather information for your locationRotating background images and quotesPomodoro timer for time managementNotes sectionIntegration...
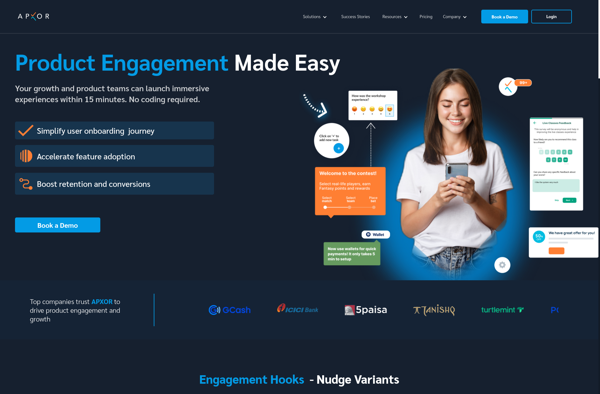
Apxor is an open-source, cross-platform password manager and encrypted vault application. Developed by Apxor LLC, it enables users to securely store passwords, sensitive documents, photos, and other private information behind one master password.Some key features of Apxor include:Intuitive and easy-to-use interfaceSecure 256-BIT AES encryption to protect vault dataOpen-source code that...
Flurry is a mobile analytics platform used by app developers to understand how consumers interact with their mobile applications. It provides key metrics like daily active users, session length, retention, and device profiles. Key features of Flurry include:User analytics - Track number of active users, sessions, frequency and length of...
Apsalar is a mobile app analytics and marketing platform designed specifically for mobile app developers and marketers. It provides:Attribution - Track app installs and events across multiple marketing channels like ads, organic, referral links and measure the true marketing ROI.Audience Segmentation - Segment users based on their actions within the...
Millimetrics is a leading construction takeoff and estimating software designed to help contractors efficiently perform digital takeoffs and create detailed estimates. As a cloud-based solution, Millimetrics provides reliable anywhere access and real-time collaboration.Key features of Millimetrics include:Intuitive takeoff tools like count, linear measure, area measure, and more to quickly extract...
Windward Dash is a powerful low-code SaaS platform designed to help teams quickly and easily create customized business documents, reports, presentations, dashboards and more. With an intuitive drag-and-drop interface, Windward Dash makes it simple for no-code and low-code users to build professional-quality outputs without needing to write any code.Some key...
YellowFin is an open-source autoML library for Python that automates the tuning of hyperparameters and model architecture search to help users achieve high accuracy with machine learning models. Developed by researchers at MIT, IIT, and Adobe Research, YellowFin aims to make state-of-the-art machine learning techniques accessible to non-experts.Some key capabilities...
JReport is a business intelligence and reporting tool used to create interactive reports and dashboards from multiple data sources. It has an easy-to-use drag-and-drop interface that allows non-technical users to quickly build reports and visualize data without coding.Some key features of JReport include:Connecting to various databases, cloud apps, big data...
Amplitude is a comprehensive product analytics platform designed to help companies understand user behavior and optimize the product experience. Key features include:Behavioral cohort analysis - Segment users into cohorts based on common behaviors to identify trends.Funnel visualization - Visualize the user journey across key workflows and conversion funnels.Retention tracking -...
Adobe Marketing Cloud is a suite of powerful marketing applications and services from Adobe that provides marketers with a unified platform to manage online advertising, analytics, personalization, content creation and management, marketing automation, customer journey management, cross-channel campaign management, audience targeting, and social media marketing.Key capabilities and benefits include:Unified customer...