Prognoz

Prognoz

Prognoz is a software program that helps organizations create accurate forecasts in a user-friendly interface. It uses predictive analytics algorithms and time series modeling to analyze historical data and project future trends with precision.
forecasting predictive-analytics time-series data-analysis

Prognoz: Predictive Analytics for Accurate Forecasts

A software program helping organizations create precise forecasts through predictive analytics, time series modeling, and user-friendly interfaces.

What is Prognoz?

Prognoz is a comprehensive business forecasting and predictive analytics platform designed to help organizations improve forecast accuracy and operational efficiency. It leverages sophisticated artificial intelligence algorithms, time series analysis, simulation modeling, and machine learning techniques to uncover patterns in historical data and generate accurate demand forecasts.

Key features of Prognoz include:

  • Intuitive drag-and-drop interface for building forecasts without coding
  • Automated model selection for determining the best-fit forecasting techniques
  • What-if scenario analysis for modeling the impact of business decisions
  • Collaboration tools for sharing insights across the organization
  • Integration with ERP, POS, and other data sources
  • Customizable dashboards and reporting for tracking KPIs

Prognoz is trusted by over 1500 corporate customers and government agencies worldwide, including Samsung, Honda, PepsiCo, and the US Department of Defense. It helps organizations in industries such as retail, manufacturing, healthcare, and banking improve demand planning, inventory optimization, promotional planning, and sales forecasting.

With its powerful analytics engine, ease of use, and flexibility to adapt to diverse business environments, Prognoz is an ideal forecasting software solution for enterprises looking to boost forecast accuracy, align operations with demand, and make smarter data-driven decisions.

Prognoz Features

Features

  1. Predictive analytics and time series modeling
  2. User-friendly interface
  3. Accurate forecasting capabilities
  4. Historical data analysis
  5. Trend projection

Pricing

  • Subscription-Based
  • Custom Pricing

Pros

Provides precise forecasts based on advanced analytics

Easy-to-use interface for non-technical users

Ability to analyze and leverage historical data

Supports decision-making with data-driven insights

Cons

Can be complex for users unfamiliar with predictive analytics

Requires investment in data collection and preparation

Potential need for specialized expertise to configure and optimize


The Best Prognoz Alternatives

Top Business & Commerce and Forecasting & Predictive Analytics and other similar apps like Prognoz


Microsoft Power BI icon

Microsoft Power BI

Microsoft Power BI is a powerful business analytics service developed by Microsoft. It empowers users to transform raw data into meaningful insights, create interactive reports and dashboards, and share data-driven stories within an organization. Power BI is designed to help businesses and individuals make informed decisions based on a comprehensive...
Microsoft Power BI image
QlikView icon

QlikView

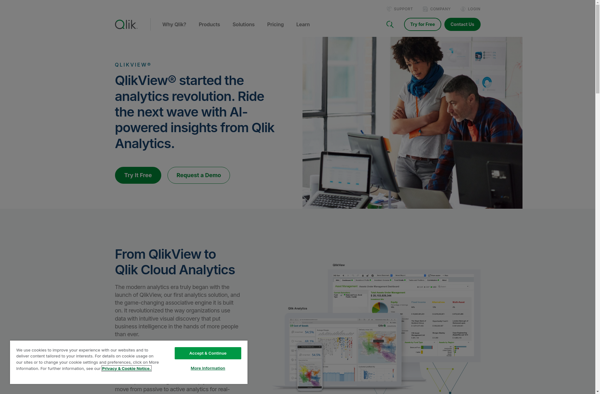
QlikView is a business intelligence and data visualization platform used to create interactive dashboards and analytics applications. It was first released in 1993 by the Swedish company Qlik. Key features of QlikView include:Associative data modeling and in-memory analytics engine - Allows fast analysis of large, disparate datasets without predefined schema...
QlikView image
Alteryx icon

Alteryx

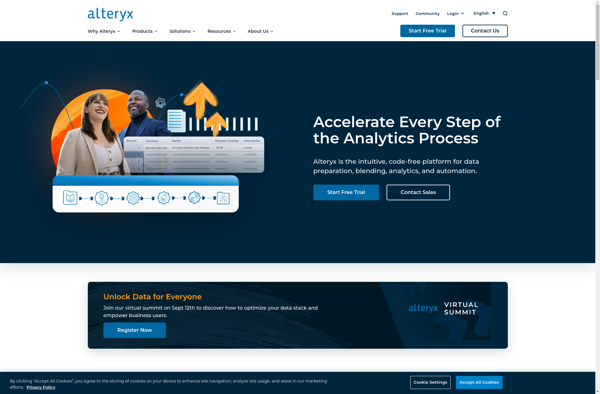
Alteryx is a data preparation and analytics software platform designed to make advanced data analytics accessible to any data worker. It provides an end-to-end platform to ingest, prepare, blend, analyze, and visualize data to gain deeper insights faster.Some key capabilities and benefits of Alteryx include:Intuitive drag-and-drop interface to prep and...
Alteryx image
Pentaho icon

Pentaho

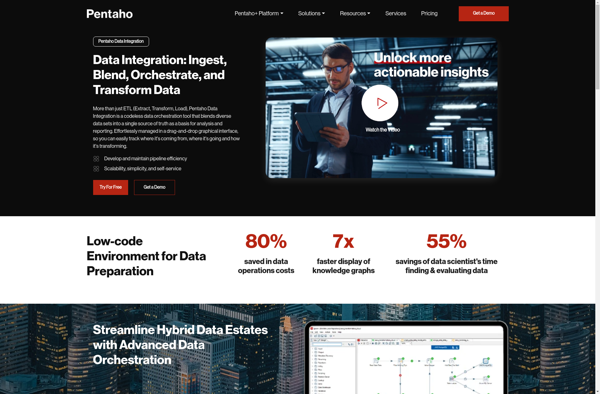
Pentaho is a comprehensive open source business intelligence (BI) suite that provides a range of data integration, analytics, visualization, reporting, data mining, and workflow capabilities. It is designed to help businesses consolidate data from disparate sources for unified analytics and reporting.Some of the key capabilities and components of Pentaho include:Data...
Pentaho image
Sisense icon

Sisense

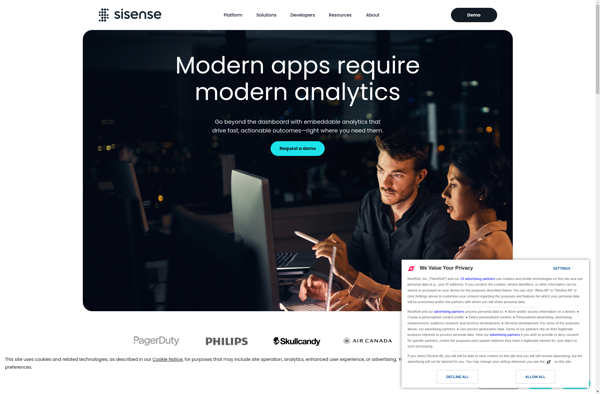
Sisense is a business intelligence and data analytics software platform designed to help non-technical users prepare, analyze and visualize complex data. Some key features of Sisense include:Intuitive drag-and-drop interface for building interactive dashboards and visualizations like charts, graphs and pivot tables without coding.Ability to connect to wide variety of data...
Sisense image
MicroStrategy Business Intelligence icon

MicroStrategy Business Intelligence

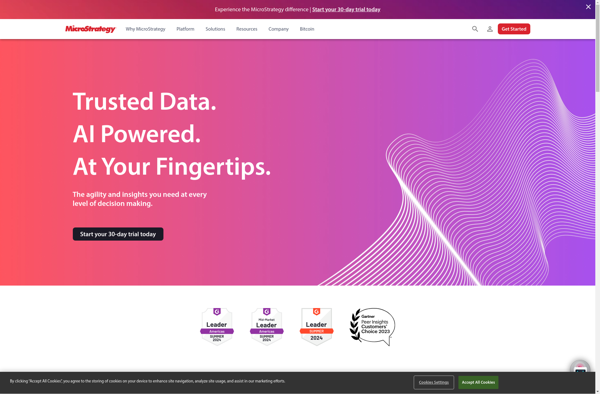
MicroStrategy is a leading enterprise analytics platform designed to help organizations make data-driven business decisions through advanced visualization and dashboarding capabilities. It serves as a one-stop solution for BI, allowing for data preparation, discovery, reporting, and predictive analytics.Key features of MicroStrategy include:Interactive dashboards and pixel-perfect reports that can be accessed...
MicroStrategy Business Intelligence image
QueryTree icon

QueryTree

QueryTree is a visual SQL analytics software designed to make query building fast and easy for any skill level. It features an intuitive drag-and-drop interface that allows users to construct complex SQL queries visually without typing code.Some key features of QueryTree include:Visual query builder with drag-and-drop fields and quick type...
QueryTree image
Windward Core - Document Generation Component icon
Windward Core - Document Generation Component

Windward Core is a document generation and reporting engine that can be licensed and integrated into other applications that need advanced document creation and editing capabilities.It provides a full featured template design interface that allows users to easily create complex, data-powered documents without any programming. Templates can include text, images,...
Windward Core - Document Generation Component image
GridGain In-Memory Data Fabric icon

GridGain In-Memory Data Fabric

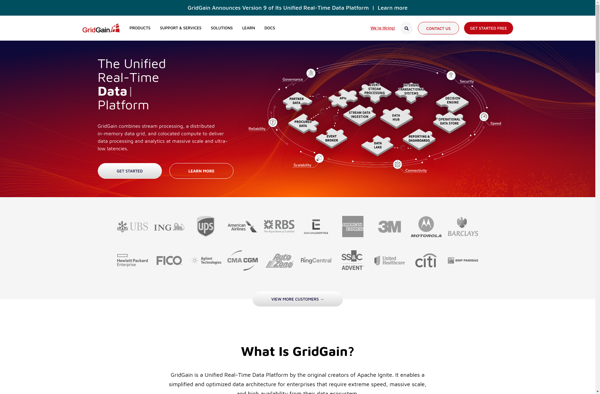
GridGain In-Memory Data Fabric is a distributed in-memory computing platform that enables organizations to develop data-intensive applications that require high performance and massive scalability. It provides an in-memory data grid that can be accessed by applications, allowing them to store and process data with in-memory speeds.Some key capabilities and benefits...
GridGain In-Memory Data Fabric image
Birst icon

Birst

Birst is a cloud-native business intelligence and analytics platform used by enterprises to unify, understand, and act on data. Key capabilities and benefits include:Cloud data warehousing to bring together data from multiple sources for analysisInteractive dashboards and visualizations to spot trends and insightsSelf-service analytics empowering users across the organization to...
Birst image
GoodData icon

GoodData

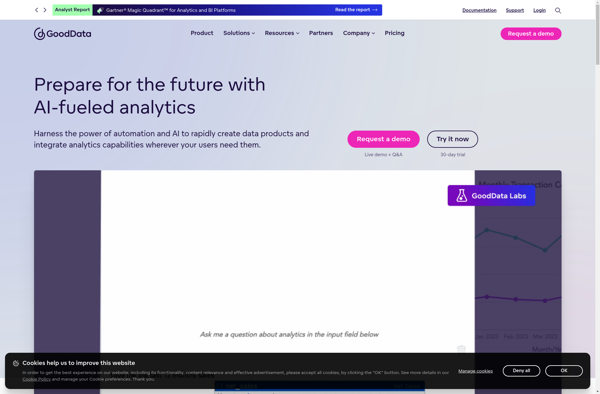
GoodData is a business intelligence and analytics platform used by companies to collect, store, and analyze their data to drive business decisions. Some key capabilities and features of GoodData include:Data warehousing and ETL - GoodData ingests data from various sources, transforms it, and loads it into a cloud data warehouse...
GoodData image
Jolicharts icon

Jolicharts

Jolicharts is a feature-rich JavaScript charting library that allows you to easily add interactive charts and graphs to web applications and dashboards. With Jolicharts, you can create over 30 types of charts including line charts, bar charts, pie charts, scatter plots, stacked bar charts and more.Some key features of Jolicharts...
KPI watchdog icon

KPI watchdog

KPI Watchdog is a robust business intelligence and data analytics platform designed to help companies track, analyze, and visualize key performance indicators (KPIs) in real-time. It provides powerful, customizable dashboards and reporting tools to monitor essential metrics across all departments and roles.With KPI Watchdog, businesses can connect data from multiple...