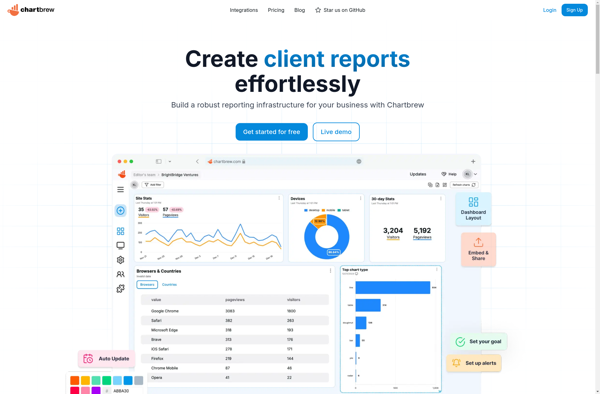
Chartbrew is an open-source business intelligence and data visualization software. It allows users to connect to data sources, build interactive charts and dashboards, and share analytics. Chartbrew is lightweight, customizable, and integrates with popular databases.
Chartbrew: Open-Source Business Intelligence and Data Visualization Software
Connect to data sources, build interactive charts and dashboards, and share analytics. Lightweight, customizable, and integrates with popular databases.
What is Chartbrew?
Chartbrew is an open-source business intelligence and data visualization platform used to analyze data and create interactive charts, graphs, and dashboards. It has an easy-to-use drag and drop interface that allows users to connect to SQL, NoSQL, CSV data sources, and SaaS applications to visualize data and find insights.
Some key features of Chartbrew include:
Interactive and sharable dashboards
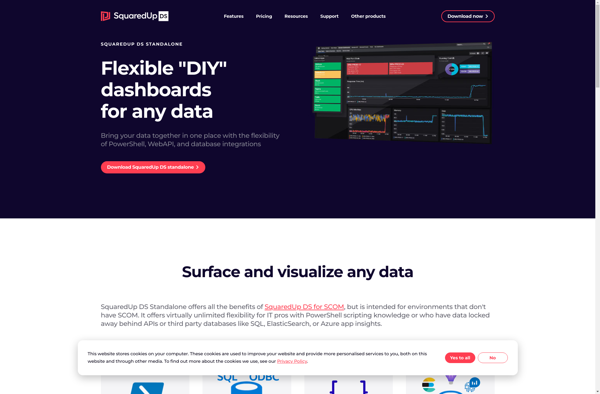
Variety of chart types including bar, pie, line, scatter, pivot tables etc.
Collaboration tools to share and discuss analytics
Scheduled reports and alerts
Customizable themes and branding
Access control and data security
As Chartbrew is open-source, it gives a high level of customizability and integrates well with other data tools. It can handle large data volumes and real-time data streams. The community behind Chartbrew is active, providing support, templates, and contributing features.
Overall, Chartbrew is a lightweight yet powerful free alternative to commercial BI tools like Tableau, Power BI, and Looker for all types of users to visualize data and make data-driven decisions.
Chartbrew Features
Features
Drag-and-drop interface to build charts/dashboards
Connects to SQL, NoSQL, CSV data sources
Supports rich visualizations - bar, pie, line, scatter plots etc
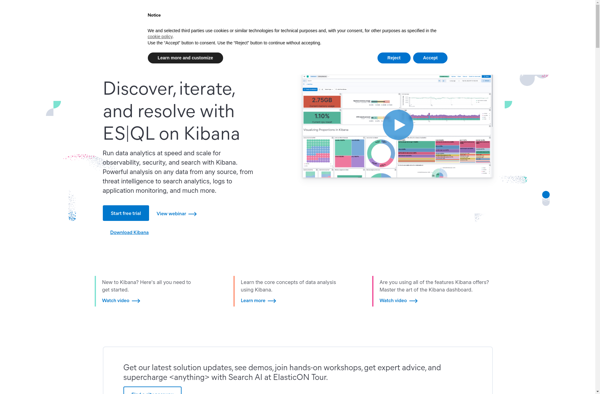
Kibana is an open source analytics and visualization platform designed to operate on top of Elasticsearch. Kibana provides search and data visualization capabilities for data indexed in Elasticsearch clusters. Some of the key capabilities and features of Kibana include:Interactive dashboards - Kibana allows users to create rich, interactive dashboards and...
Grafana is a feature-rich, open source analytics and monitoring visualization suite. It integrates tightly with a variety of database technologies like Graphite, Prometheus, InfluxDB, Elasticsearch, and more to allow for easy exploration and visualization of time series data. Some key capabilities and benefits of Grafana include:Intuitive graphical UI makes it...
Microsoft Power BI is a powerful business analytics service developed by Microsoft. It empowers users to transform raw data into meaningful insights, create interactive reports and dashboards, and share data-driven stories within an organization. Power BI is designed to help businesses and individuals make informed decisions based on a comprehensive...
Looker Studio is a business intelligence and analytics platform designed to help companies analyze data and gain valuable insights. It provides an intuitive, web-based interface that enables users without technical skills to explore, visualize and share data easily.Some key capabilities and benefits of Looker Studio include:Interactive dashboards - Users can...
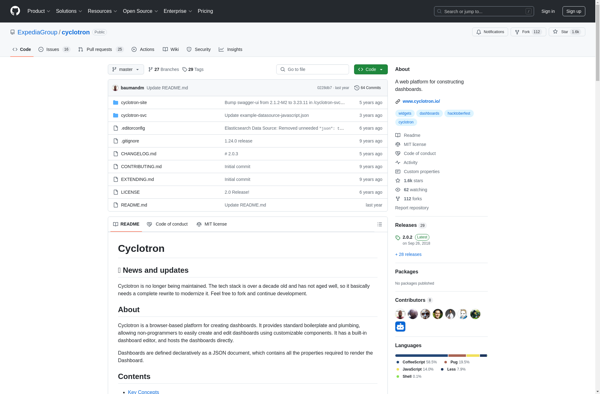
Cyclotron is an open-source task management and productivity application for Windows, macOS, and Linux operating systems. It provides users with a flexible framework to organize individual tasks as well as larger projects.Key features of Cyclotron include:Custom categories, tags, milestones, and workflows to categorize tasks and structure projectsCalendar and reminder system...
Freeboard is an open-source business intelligence and data visualization software. It provides an intuitive drag-and-drop interface that allows users to visualize data from multiple sources, without needing to code. Some key features of Freeboard include:Connectivity to a variety of data sources like SQL databases, REST APIs, MQTT, and moreLibrary of...
Redash is an open-source business intelligence and data visualization web application. It allows users to connect to multiple data sources including SQL databases, query and visualize the data, and create interactive dashboards to share insights.Some key features of Redash:Connect to data sources like PostgreSQL, MySQL, SQL Server, Redshift, BigQuery and...
Chartio is a cloud-based business intelligence and data visualization platform designed to help companies analyze data and share actionable insights. It allows users to connect a variety of data sources including databases, cloud apps, and spreadsheets, and build interactive dashboards and charts.Key features of Chartio include:Intuitive drag and drop interface...
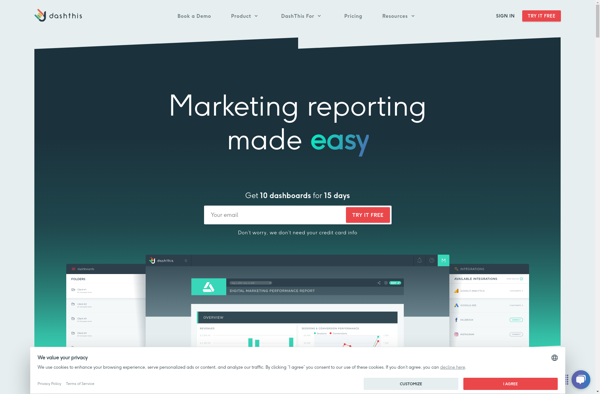
DashThis is a user-friendly project management and task tracking application designed for small teams and businesses. It provides an intuitive interface to plan projects, create tasks, set due dates, assign work to team members, track progress, and collaborate with others.Some key features of DashThis include:Flexible project views - See all...
SquaredUp Community Dashboard Server is a free and open-source IT infrastructure monitoring and analytics platform. It allows organizations to create customizable dashboards that provide visibility into their IT systems, applications, networks, and services.With SquaredUp Community, you can connect to various data sources like Windows performance counters, SNMP devices, SQL Server,...