Kibana
Kibana: Open-Source Data Visualization Dashboard for Elasticsearch
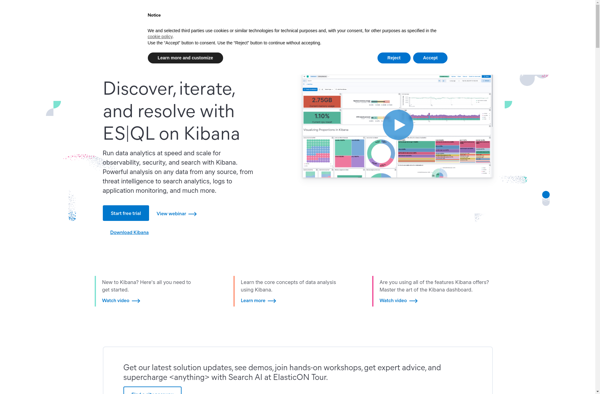
Kibana is an open-source data visualization dashboard for Elasticsearch. It provides visualization capabilities on top of the content indexed on an Elasticsearch cluster. Users can create bar, line and scatter plots, or pie charts and maps on top of large volumes of data.
What is Kibana?
Kibana is an open source analytics and visualization platform designed to operate on top of Elasticsearch. Kibana provides search and data visualization capabilities for data indexed in Elasticsearch clusters. Some of the key capabilities and features of Kibana include:
- Interactive dashboards - Kibana allows users to create rich, interactive dashboards and visualizations that combine different charts, graphs and maps on a single page. Dashboards can be customized and shared.
- Ad hoc analysis - Quickly perform ad hoc analysis of data in Elasticsearch through simple searches and aggregations. Analyze data on the fly and visualize it using charts.
- Pre-built visualizations - Kibana comes with many pre-built visualizations like histograms, line graphs, scatter plots, geo maps etc. Users can customize these according to their use case.
- Alerting and reporting - Set up alerts and define periodic reports to monitor data and get notified of important changes.
- Time series analysis - Analyze time stamped data to plot trends over time. Perform statistical analysis.
- Plugin ecosystem - There are various third party plugins that extend Kibana's capabilities for dashboards, visualizations, authentication and connectors.
Overall, Kibana makes it easy to visualize, explore and analyze data stored in Elasticsearch in real time. It's suitable for search, analytics, log analysis and operational intelligence use cases across many industries.
Kibana Features
Features
- Real-time analytics and visualizations
- Pre-built and customizable dashboards
- Time-series analysis
- Geospatial and coordinate maps
- Shareable dashboards and visualizations
- Alerts and notifications
Pricing
- Open Source
Pros
Cons
Official Links
Reviews & Ratings
Login to Review20 reviews
Rating Breakdown
Recent Reviews
Anna King
Apr 28, 2026Powerful but Demanding Visualization Tool
Kibana is incredibly powerful for visualizing Elasticsearch data, and the dashboards I've built are impressive and insightful. However, the initial learning curve is steep, and the interface can feel clunky and unintuitive for new users. The reliance on a perfectly …
Lisa Miller
Apr 24, 2026Powerful Visualization Tool for Elasticsearch Data
As a data analyst working with Elasticsearch, Kibana has been a game-changer for our team. The ability to create custom dashboards with charts, maps, and visualizations directly on our indexed data saves us hours of manual reporting. While there's a …
Casey Thomas
Apr 24, 2026Powerful but Painfully Complex
While Kibana's visualization capabilities are undeniably powerful, the learning curve is incredibly steep. The interface feels clunky and unintuitive, making simple tasks like creating a dashboard or modifying a chart a frustrating exercise in trial and error. For smaller teams …
Riley Thomas
Apr 20, 2026Indispensable for Elasticsearch Visualization
Kibana has been a game-changer for our team's data analysis. Its seamless integration with Elasticsearch makes it incredibly powerful for slicing and dicing our massive datasets into clear, actionable dashboards. The variety of visualizations, from time series graphs to geospatial …
Avery Moore
Apr 20, 2026An Essential Dashboard for Elasticsearch Data
As a data analyst, Kibana has been a game-changer for visualizing our Elasticsearch logs and metrics. The ability to quickly build interactive dashboards with line charts, maps, and aggregations makes complex data instantly understandable. The learning curve is a bit …
Rating Distribution
The Best Kibana Alternatives
View all Kibana alternatives with detailed comparison →
Top Ai Tools & Services and Data Analytics and other similar apps like Kibana
Here are some alternatives to Kibana:
Suggest an alternative ❐Datadog

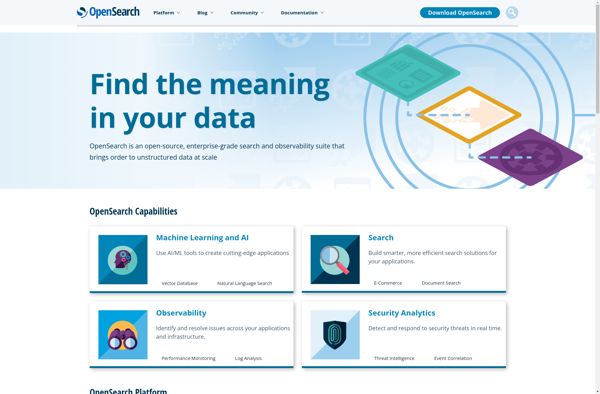
OpenSearch
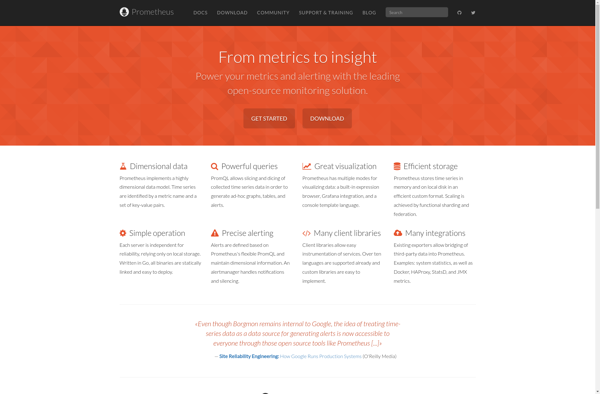
Prometheus
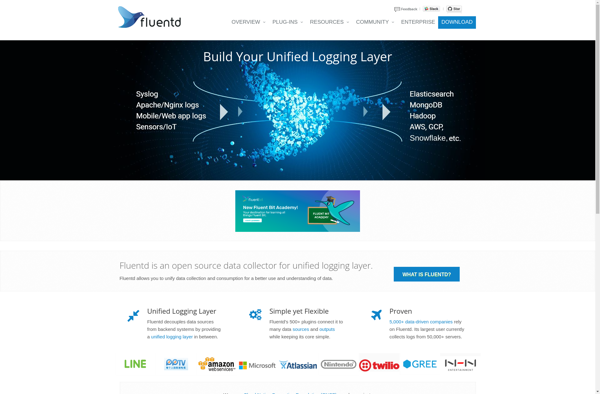
Fluentd
Logz.io
Grafana

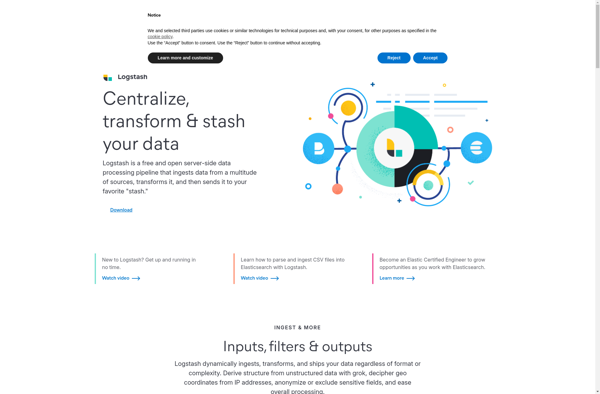
Logstash
Graylog
Loggly
Papertrail
SenseLogs
Logentries
Sawmill

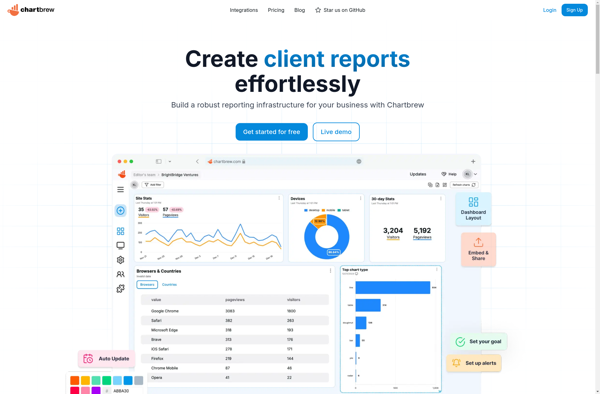
Chartbrew
Knowi
Scalyr
SigNoz
LogLogic
Logmatic.io
Hindsight

IQLECT

Devo
