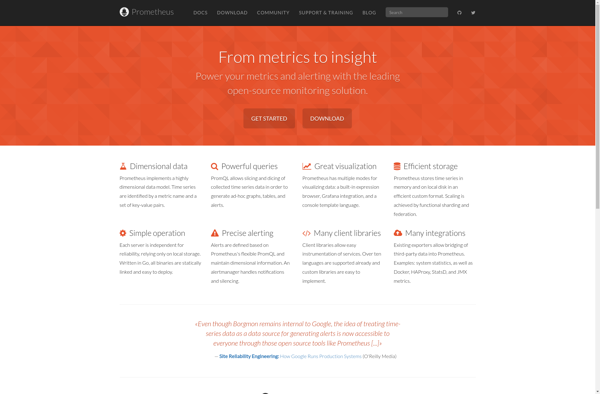
Prometheus is an open-source systems monitoring and alerting toolkit. It collects metrics from configured targets at given intervals, evaluates rule expressions, displays the results, and can trigger alerts if certain conditions are met.
Prometheus: Open-Source Systems Monitoring and Alerting Toolkit
A comprehensive systems monitoring and alerting toolkit with open-source capabilities, offering metrics collection, rule evaluation, result display, and alert triggering.
What is Prometheus?
Prometheus is an open source monitoring and alerting system optimized for containerized environments like Kubernetes. It provides real-time visibility into applications, infrastructure, and services running in an environment.
Prometheus works by scraping and storing time series data from various systems and services. It collects metrics from targets using either a pull model or a push model. Prometheus runs queries against this data to generate real-time graphs, alerts, and dashboards.
Some key features of Prometheus include:
A multi-dimensional data model with time series data identified by metric name and key/value pairs
PromQL, a flexible query language to leverage this dimensionality
No reliance on distributed storage; single server nodes are autonomous
Time series collection happens via a pull model over HTTP
Pushing time series is supported via an intermediary gateway
Targets are discovered via service discovery or static configuration
Multiple modes of graphing and dashboarding support
Built-in alertmanager for handling alerts and on-call rotations
Prometheus is commonly used together with Grafana for dashboarding, visualization, and alerting; as well as exporters to extract metrics from common software and hardware systems already present in an environment.
Prometheus Features
Features
Multi-dimensional data model with time series data identified by metric name and key/value pairs
PromQL, a flexible query language to leverage this dimensionality
No reliance on distributed storage; single server nodes are autonomous
Time series collection happens via a pull model over HTTP
Pushing time series is supported via an intermediary gateway
Targets are discovered via service discovery or static configuration
Multiple modes of graphing and dashboarding support
Pricing
Open Source
Pros
Highly dimensional model allows flexible and efficient queries
PromQL supports aggregation and recording rules for pre-calculation
Built-in alerting and notification routing
Highly available with simple operational model
Native support for Kubernetes
Strong ecosystem integration
Cons
Pull-based model can miss short-lived spikes between scrapes
No automatic removal of stale metrics (extra storage usage)
Limited tooling for stats analysis, forecasting, anomaly detection
Prometheus has become the cornerstone of our observability stack. Setting up exporters and defining alert rules was straightforward, and the PromQL query language is incredibly powerful for slicing and dicing metrics. While the initial setup requires some learning, its reliability …
As a small team trying to monitor a few services, Prometheus has been a massive headache. The learning curve is incredibly steep; just configuring basic scraping and writing alert rules in PromQL felt like a full-time course. While it's free …
Prometheus has been a game-changer for our team's infrastructure monitoring. Its pull-based model and powerful query language (PromQL) make it incredibly flexible for tracking custom metrics from our microservices. Setting up alerting rules was straightforward, and we've caught several potential …
Prometheus is incredibly powerful for monitoring our cloud infrastructure and its alerting system is top-notch. However, the initial setup and configuration, especially for custom metrics, has a steep learning curve that requires significant time investment. The query language is flexible …
Prometheus is incredibly powerful for collecting and alerting on our system metrics, and its query language is very flexible. However, the initial setup and configuration can be daunting, and managing long-term storage feels like a complex add-on project. The open-source …
Datadog is a SaaS-based monitoring and analytics platform for cloud applications. It provides complete visibility into dynamic infrastructures by aggregating metrics, events, and logs from servers, containers, databases, tools, and services. This allows Dev and Ops teams to quickly solve performance problems, prove the root cause of software bugs, spot...
Splunk is a software platform that enables users to search, analyze, and visualize the data gathered from the infrastructure, systems, and applications of an organization. It captures, indexes, and correlates real-time data in a searchable repository from which it can generate graphs, reports, alerts, dashboards, and visualizations.Some key features and...
New Relic is a comprehensive application performance monitoring and observability platform used by software engineers to monitor, troubleshoot, and optimize their applications and infrastructure. It provides real-time visibility into the performance, health, and usage of applications running in cloud, hybrid, and on-premises environments.Key features of New Relic include:Application monitoring -...
What Is Rollbar?Rollbar is an error monitoring and crash reporting platform for software applications. It captures, aggregates, and alerts on errors in real-time across web, mobile, and backend applications, helping development teams find and fix bugs faster.Key FeaturesRollbar automatically groups similar errors together, reducing noise from thousands of individual error...
Kibana is an open source analytics and visualization platform designed to operate on top of Elasticsearch. Kibana provides search and data visualization capabilities for data indexed in Elasticsearch clusters. Some of the key capabilities and features of Kibana include:Interactive dashboards - Kibana allows users to create rich, interactive dashboards and...
Fluentd is an open source data collector designed for processing data streams. It works by having input plugins that collect data from various sources, processing plugins that transform the data, and output plugins that send the data to various destinations.Some key features of Fluentd include:Unified logging layer - It allows...
logz.io is a cloud-native log management and analytics platform designed for modern cloud-based architectures. It offers the following key capabilities:Real-time log analysis - logz.io ingests and indexes log data from any source in real-time, allowing you to search and analyze log data on-the-fly.Intelligent alerting - Configure advanced correlation rules to...
Logstash is an open source, server-side data processing pipeline that ingests data from a multitude of sources simultaneously, transforms it, and then sends it to your favorite "stash."It is typically used as part of the ELK stack (Elasticsearch, Logstash, Kibana) for logging use cases. Logstash ingest data from various input...
Graylog is an open source log management and analysis platform optimized for high volumes of machine-generated data. It collects, indexes, and analyzes log messages, events, and other time-series data from various systems and applications.Some key features and capabilities of Graylog include:Real-time processing and analysis of log data as it is...
InfluxDB is an open-source time series database optimized for fast, high-availability storage and retrieval of time series data in fields such as operations monitoring, application metrics, Internet of Things sensor data, and real-time analytics.As a time series database, InfluxDB specializes in handling time stamped data, such as server monitoring data,...
Logsniffer is a useful open source web log analyzer software that helps website owners, developers and administrators visualize and monitor traffic coming to their sites. It works by processing standard web server log files like Apache and Nginx access logs and transforming the data into insightful statistics and charts.Some key...
Nagios Log Server is an open-source solution for log monitoring, analysis and alerting. It is designed to address the growing need for centralized log data and event monitoring in IT environments.Key features and capabilities include:Real-time log data aggregation from multiple sources like files, databases, network devices and morePowerful searching and...
Papertrail is a cloud-based log management and analysis platform designed for infrastructure monitoring, application troubleshooting, and compliance reporting. It aggregates log data in real-time from servers, clouds, containers, and applications into a centralized, searchable web archive.Key features of Papertrail include:Real-time log streaming - Logs are streamed to Papertrail in real-time...
RapidSpike is a powerful yet easy-to-use load and performance testing tool designed for testing the performance of web applications. It provides the ability to simulate hundreds or thousands of concurrent virtual users to generate realistic workloads on web apps to identify performance bottlenecks and ensure applications can handle expected traffic.Key...
Amazon CloudWatch is a monitoring and management service that provides data and actionable insights for AWS resources and applications. CloudWatch delivers metrics, logs, and events to help developers, operations engineers, and IT managers understand how the components of their applications and infrastructure are performing so they can optimize for efficiency,...
VictoriaMetrics is an open-source time series database optimized for high-cardinality datasets and high ingestion rates. It is purpose-built for operations monitoring and alerting use cases.Key features and benefits of VictoriaMetrics include:Highly efficient data compression enabling significantly lower storage costs compared to alternatives like PrometheusOptimized for fast data ingestion rates exceeding...
SenseLogs is a user research and feedback platform designed to help product teams better understand user needs and pain points. The software provides an end-to-end solution for planning, conducting, and analyzing qualitative user research.Key features of SenseLogs include:Recruiting - Integrates with panel providers to recruit target users that match your...
Logentries is a cloud-based log management service that provides log aggregation, real-time log analysis and visualization, intelligent alerting, and log archive search. Some key features include:Real-time streaming of log data from servers, cloud platforms, networks, web apps, mobile apps etc.Powerful analytics to visualize trends, statistics, frequences etc. in your log...
Sawmill is a powerful log analysis and reporting platform for IT administrators and developers. It collects log data from multiple sources across your infrastructure and applies intelligent parsing to extract meaningful information.With customizable dashboards and reports, Sawmill gives you visibility into application usage, user behavior, security threats, and more. Some...
Timber is an open source WordPress plugin created by Upstatement that allows developers to build WordPress themes using the Twig PHP templating engine. It serves as a templating framework that integrates Twig into WordPress themes for a cleaner, more sustainable code base.Some of the key benefits of using Timber for...
Scalyr is a log management and observability platform designed for monitoring, troubleshooting, and securing cloud-native infrastructure and applications. Key capabilities and features include:Real-time log, metric, and event collection from servers, containers, services, and applicationsPowerful search and filtering for rapid troubleshooting and forensic analysisCustomizable dashboards and alerts for proactive monitoringAutomatic parsing...
CloudMonix is a comprehensive cloud management platform designed to provide visibility, governance, and automation across public, private, and hybrid cloud environments. Here are some key capabilities of CloudMonix:Multi-cloud monitoring and management - Discover workloads across AWS, Azure, GCP and Kubernetes and gain unified visibility into resource utilization, performance, cost, security,...
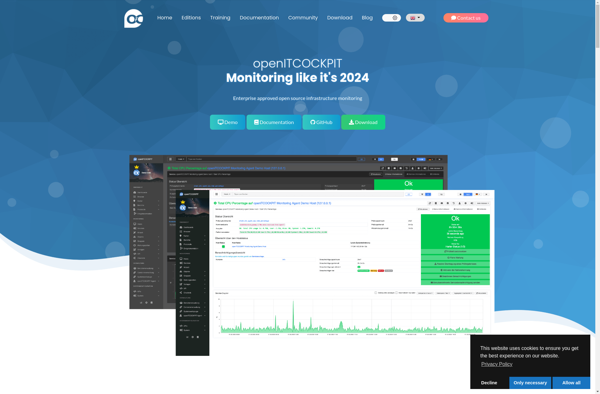
openITCOCKPIT is an open source, web-based IT management and monitoring platform. It provides monitoring capabilities for networks, servers, applications, services, virtual environments and more. Some key features include:Intuitive dashboard for viewing system statusMonitoring modules for Linux, Windows, SNMP, VMware, Docker and moreCustomizable alerts and notifications via email, Slack, Telegram etc.Visual...
Open Web Analytics (OWA) is an open source web analytics platform that you can use to track and analyze traffic on your websites. It provides a wealth of data to help you understand your visitors and make better decisions about your online marketing and content strategy.Some key features of OWA...
LogLogic is a comprehensive log management and analytics platform designed for enterprises. It collects and aggregates log data from across an organization's entire IT infrastructure including servers, networks, security devices, operating systems and applications. Key capabilities of LogLogic include:Real-time log monitoring and analysis to detect anomalies and threatsInteractive search across...
Wavefront by VMware is a scalable, high-performance metrics monitoring and analytics platform delivered through an end-to-end SaaS solution. It provides real-time granular visibility across complex, modern cloud environments.Key capabilities and benefits of Wavefront include:Ability to collect and analyze metrics and events data from various sources like containers, microservices, cloud platforms...
VividCortex is a comprehensive database monitoring and analytics platform designed specifically for MySQL, PostgreSQL, MongoDB, Redis, and other popular databases. It provides unparalleled visibility into your database workload, queries, performance issues, and trends.Key features of VividCortex include:Real-time monitoring of all database queries, with full query details and execution statisticsVisual explain...
Hosted Graphite is a Software-as-a-Service platform that provides cloud-based monitoring and observability for applications and infrastructure. It specializes in analyzing time-series data such as metrics, logs, and events to provide insights into performance, availability, and usage trends.Key features of Hosted Graphite include:Customizable dashboards for visualizing metrics and building graphsAlerting based...
Logscape is a log management and analytics platform designed to help IT teams aggregate, analyze, and visualize machine data from across their infrastructure and applications. Some key capabilities and benefits of Logscape include:Real-time log aggregation from physical servers, virtual machines, cloud platforms, containers, network devices, and more using lightweight agentsOut-of-the-box...
Logmatic.io is a cloud-based log management and analytics platform designed for developers and IT teams. It provides the ability to aggregate logs and events from across an infrastructure into a single location for analysis and troubleshooting.Key features of Logmatic.io include:Real-time streaming of logs and events using a variety of collection...
CloudPelican is a innovative cloud-based document management and file sharing service designed to help teams collaborate and share files easily and securely. Here are some key capabilities of CloudPelican:Cloud-based storage - Store all your business documents, images, videos and more in the cloud. Access them from anywhere on any device.File...
OTUS SIEM is a security information and event management platform purpose-built for enterprises that need to manage IT infrastructure at scale. It collects log and event data from across an organization's networks, endpoints, cloud services, and other systems.Powerful analytics help OTUS SIEM detect advanced threats and zero-day attacks while providing...
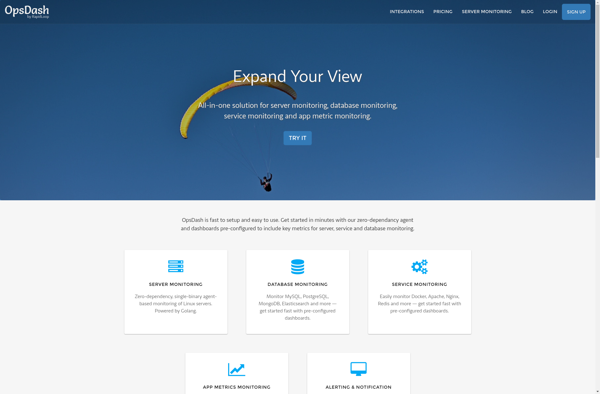
OpsDash is an open-source IT dashboard and monitoring solution designed for teams to visualize critical information about their infrastructure and applications. It provides real-time visibility into system metrics, application performance, log events, and network health to improve situational awareness.Key features of OpsDash include:Customizable dashboards to monitor infrastructure, apps, services, and...
XpoLog is a comprehensive cloud-based logistics management software designed for shippers, third-party logistics providers (3PLs), freight brokers, and carriers. It features robust transportation management, warehouse management, order management, and inventory management tools to help streamline operations.Key capabilities and benefits of XpoLog include:Transportation management - automates planning, execution, tracking, and settlement...
Mothership is a cloud-based project management and collaboration software designed for agile teams. It provides a variety of features to help organize work and enable effective teamwork:Task management with kanban boards to visualize work status and progressFile sharing and cloud storage to centralize team documents and filesTime tracking to monitor...
Loom Systems is an AI-powered IT operations (AIOps) platform designed to help enterprises monitor, analyze, and optimize their IT environments. The software uses machine learning and predictive analytics to provide actionable insights across infrastructure and applications.Key capabilities and benefits of Loom Systems include:Intelligent monitoring and alerting - Automatically detects anomalies...
CloudScreener is a multi-cloud security and compliance monitoring solution designed to provide organizations with continuous visibility and control across their cloud environments. It supports the major cloud platforms - AWS, Azure, and GCP.Key features of CloudScreener include:Automated inventory of cloud assets across services like EC2, S3, VPC, Storage Accounts, SQL...
ErrorFeed is a robust error and exception monitoring software used by developers and IT teams to track errors and crashes in web and mobile applications. It gives real-time alerting about app issues and integrates seamlessly with platforms like JavaScript, .NET, Java, Ruby, PHP and more.Key features include:Real-time error monitoring with...
RST Cloud is a cloud-based document creation, collaboration, and publishing platform used by organizations to streamline the creation and distribution of business documents. It provides real-time co-authoring capabilities so multiple people can work on documents simultaneously from any device.Key features of RST Cloud include:Intuitive WYSIWYG editor for creating professional, branded...
IQLECT is an e-learning software used to create interactive online courses and training programs. It provides a suite of tools that enable teachers, professors, corporate trainers and instructional designers to author rich and engaging learning content.Key features of IQLECT include:Intuitive course authoring tools to build interactive lessons, assessments, simulations, scenarios...
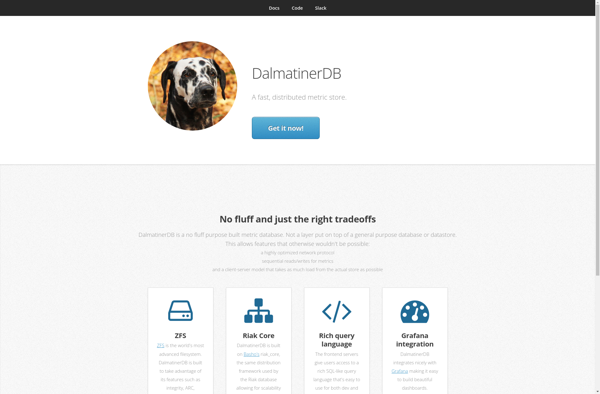
DalmatinerDB is an open-source, high-performance metrics database and time-series database (TSDB) written in Erlang. It is designed to collect, store and query large volumes of time-series data with millisecond precision.Some key features and benefits of DalmatinerDB include:Fast writes - Optimized to handle high velocity data with minimal latency. Can handle...
Monique.io is an open-source web analytics platform built with privacy in mind. It aims to provide website owners useful analytics and insights without compromising visitor privacy.Unlike Google Analytics, Monique.io collects only essential and anonymous analytics data. It does not use cookies or unique identifiers to track users across websites. The...
Log Collector is a log management and analysis software that helps organizations aggregate log data from across their IT infrastructure into a centralized repository. It collects log data from servers, network devices, applications, cloud platforms, and more using built-in integrations or APIs.Once the log data is aggregated, Log Collector provides...
Monometric.IO is a powerful yet easy-to-use server and infrastructure monitoring solution designed for modern IT teams. It provides real-time visibility into the health, performance, and availability of servers, websites, applications, and more.Key features include:Customizable dashboards showing key infrastructure metrics and statusAutomatic detection and monitoring of servers and cloud resourcesFlexible alerting...