Loom Systems is an AI-powered IT operations platform that helps companies monitor, manage, and optimize their IT environments. It provides insights into infrastructure and applications to prevent issues, automate tasks, and improve efficiency.
Loom Systems helps companies monitor, manage, and optimize their IT environments with AI-powered insights into infrastructure and applications to prevent issues, automate tasks, and improve efficiency.
What is Loom Systems?
Loom Systems is an AI-powered IT operations (AIOps) platform designed to help enterprises monitor, analyze, and optimize their IT environments. The software uses machine learning and predictive analytics to provide actionable insights across infrastructure and applications.
Key capabilities and benefits of Loom Systems include:
Intelligent monitoring and alerting - Automatically detects anomalies and issues in real-time across servers, networks, databases, and more.
Root cause analysis - Analyzes interdependencies and patterns to determine the root cause of performance issues.
Incident management - Helps teams prevent, troubleshoot, and resolve infrastructure and application incidents quickly.
Automated remediation - Can automatically resolve and prevent recurring issues through integration with tools like Ansible, Puppet, and ServiceNow.
Optimization - Continuously tunes configurations, resource allocation, and data architecture for improved efficiency.
Loom Systems integrates with existing monitoring, ITSM, and DevOps tools. It provides prebuilt connectors for solutions like Splunk, SolarWinds, ServiceNow, and Ansible. The company offers a free trial for proof-of-concept deployments.
Loom Systems Features
Features
AI-powered log analysis and anomaly detection
Real-time infrastructure monitoring
Automated incident remediation
Resource optimization recommendations
Predictive capacity planning
Customizable dashboards and alerts
Integration with popular IT tools and services
Pricing
Subscription-Based
Pros
Reduces mean time to resolution for IT incidents
Improves efficiency and productivity of IT teams
Provides actionable insights from log data
Optimizes resource utilization
Lowers infrastructure costs
Cons
Requires time investment to properly configure and customize
Additional vendor lock-in
May generate false positives without proper tuning
Datadog is a SaaS-based monitoring and analytics platform for cloud applications. It provides complete visibility into dynamic infrastructures by aggregating metrics, events, and logs from servers, containers, databases, tools, and services. This allows Dev and Ops teams to quickly solve performance problems, prove the root cause of software bugs, spot...
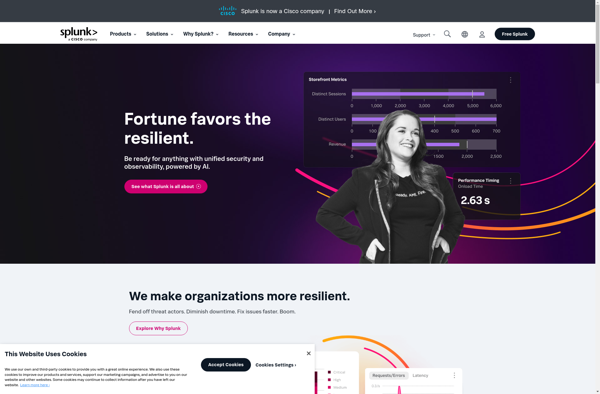
Splunk is a software platform that enables users to search, analyze, and visualize the data gathered from the infrastructure, systems, and applications of an organization. It captures, indexes, and correlates real-time data in a searchable repository from which it can generate graphs, reports, alerts, dashboards, and visualizations.Some key features and...
New Relic is a comprehensive application performance monitoring and observability platform used by software engineers to monitor, troubleshoot, and optimize their applications and infrastructure. It provides real-time visibility into the performance, health, and usage of applications running in cloud, hybrid, and on-premises environments.Key features of New Relic include:Application monitoring -...
What Is AppDynamics?AppDynamics is an application performance monitoring (APM) and observability platform owned by Cisco. It provides real-time visibility into application performance, user experience, and business impact across complex distributed systems.Key FeaturesAppDynamics automatically discovers and maps application topology — every service, database, API call, and third-party dependency. It traces individual...
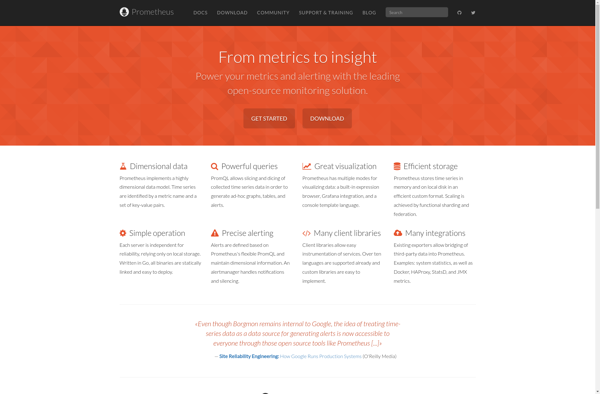
Prometheus is an open source monitoring and alerting system optimized for containerized environments like Kubernetes. It provides real-time visibility into applications, infrastructure, and services running in an environment.Prometheus works by scraping and storing time series data from various systems and services. It collects metrics from targets using either a pull...
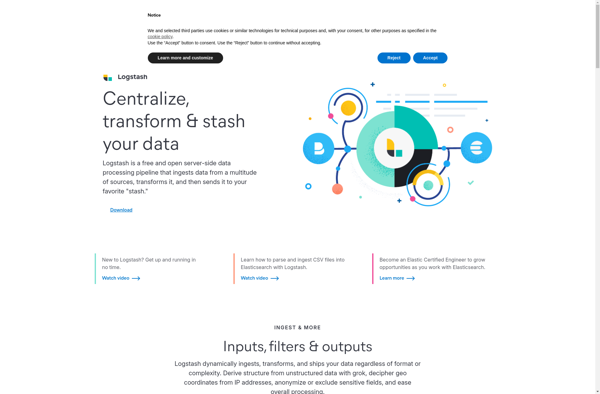
Logstash is an open source, server-side data processing pipeline that ingests data from a multitude of sources simultaneously, transforms it, and then sends it to your favorite "stash."It is typically used as part of the ELK stack (Elasticsearch, Logstash, Kibana) for logging use cases. Logstash ingest data from various input...
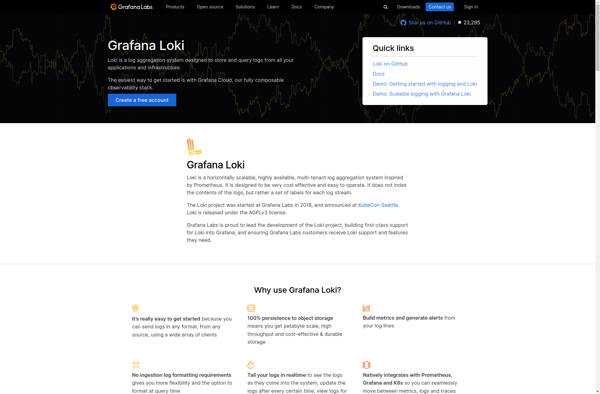
Grafana Loki is an open source logging aggregation system designed specifically for cloud native infrastructure. It is optimized for saving, indexing, and querying logs through labels and streams rather than unstructured text.Some key features of Grafana Loki include:Horizontally scalable - built on top of Prometheus's remote write protocol.Log queries -...
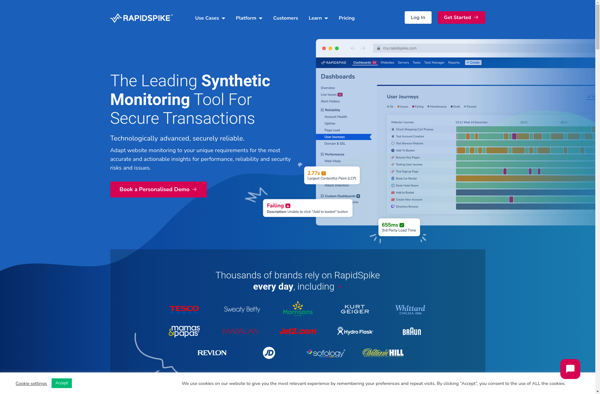
RapidSpike is a powerful yet easy-to-use load and performance testing tool designed for testing the performance of web applications. It provides the ability to simulate hundreds or thousands of concurrent virtual users to generate realistic workloads on web apps to identify performance bottlenecks and ensure applications can handle expected traffic.Key...
SenseLogs is a user research and feedback platform designed to help product teams better understand user needs and pain points. The software provides an end-to-end solution for planning, conducting, and analyzing qualitative user research.Key features of SenseLogs include:Recruiting - Integrates with panel providers to recruit target users that match your...
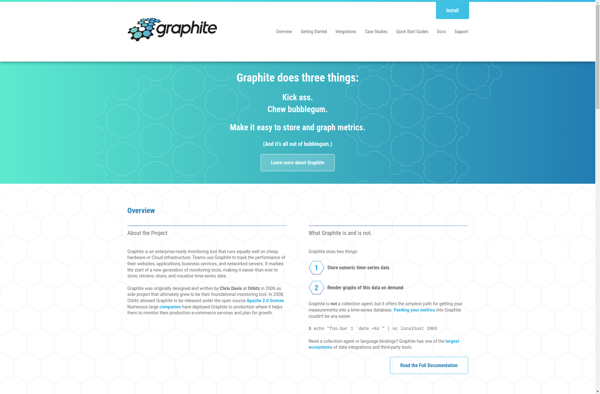
Graphite is an open-source monitoring and graphing tool used to store, visualize, and monitor time-series data from servers, applications, or other systems. It is designed to be highly scalable and robust for handling high volume metric collection and visualization.Some key features and components of Graphite include:Carbon - a high-performance service...
Sumo Logic is a cloud-native, machine data analytics platform designed to help IT teams and developers manage, analyze, and gain real-time insights from massive volumes of machine data generated by their digital services, applications, and infrastructure. It allows users to collect, ingest, and analyze log, metric, tracing, and other time-series...
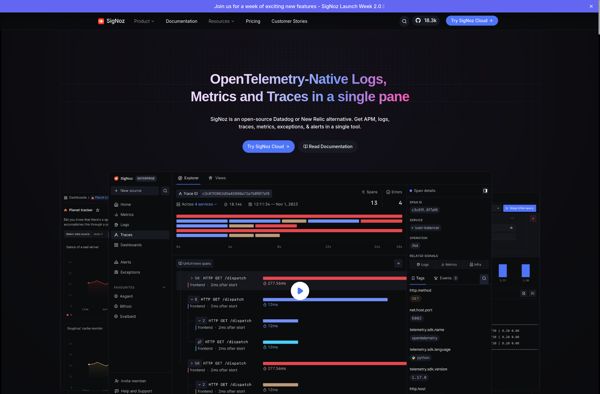
SigNoz is an open-source alternative to commercial Application Performance Monitoring (APM) tools like DataDog, New Relic, and Dynatrace. It is a cloud-native observability platform designed specifically for monitoring modern distributed systems.Some key capabilities and benefits of SigNoz include:Lightweight and optimized for microservices, serverless, and Kubernetes environmentsCollects metrics, traces, and logs...