Graphite Monitoring

Graphite Monitoring

Graphite is an open-source monitoring tool that stores time-series data and renders graphs of this data on demand. It is designed to be highly scalable to handle metrics from many servers and applications.
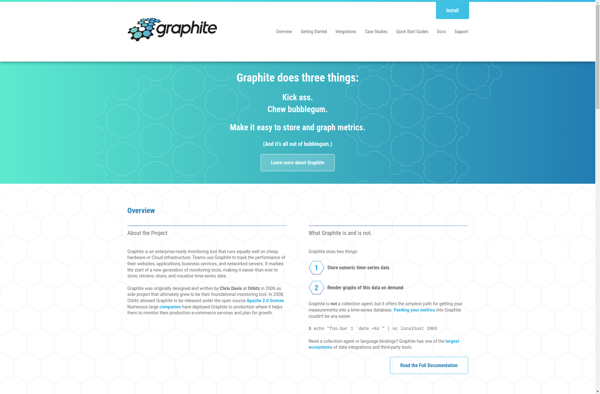
Graphite Monitoring image
metrics timeseries visualization scalable

Graphite: Open-Source Monitoring Tool

Graphite is an open-source monitoring tool that stores time-series data and renders graphs of this data on demand. It is designed to be highly scalable to handle metrics from many servers and applications.

What is Graphite Monitoring?

Graphite is an open-source monitoring and graphing tool used to store, visualize, and monitor time-series data from servers, applications, or other systems. It is designed to be highly scalable and robust for handling high volume metric collection and visualization.

Some key features and components of Graphite include:

  • Carbon - a high-performance service that collects numeric time-series data and writes it to disk as it is sent to Graphite
  • Whisper - a simple database library for storing time-series data (used by Carbon)
  • Graphite Web App - A Django web app that renders graphs and dashboards from data stored in Whisper databases
  • High scalability - Capable of processing and graphing millions of metrics per minute
  • Real-time graphing - Visualize performance stats and operational health in real-time
  • Dashboards - Customizable dashboards for visualization of important metrics
  • Retention policies - Configurable data retention rules (e.g. keep 60 seconds precision for 24 hours, 1 minute precision for 10 years, etc)

Overall, Graphite provides a reliable, high-performance tool for collecting, storing and visualizing time-series data across a variety of systems and applications.

Graphite Monitoring Features

Features

  1. Real-time graphing
  2. Dashboard creation
  3. Alerting and notifications
  4. Data visualization
  5. Metrics aggregation
  6. Customizable graphs and dashboards
  7. Integration with StatsD and collectd

Pricing

  • Open Source

Pros

Open source and free

Scalable architecture

Wide range of integrations

Flexible graphing and dashboarding

Powerful API for automation

Large community support

Cons

Steep learning curve

Complex configuration

No built-in data collection agents

Limited alerting capabilities

Requires additional tools for full-stack monitoring


The Best Graphite Monitoring Alternatives

Top Network & Admin and Monitoring and other similar apps like Graphite Monitoring


RRDTool icon

RRDTool

RRDTool (Round Robin Database Tool) is an open source data logging and graphing system for time series data. It allows you to store numeric data over time and then visualize that data through graphs and charts.Some key features of RRDTool include:Efficient storage of time-series data through round-robin databasesAutomated data consolidation...
RRDTool image
LogLogic icon

LogLogic

LogLogic is a comprehensive log management and analytics platform designed for enterprises. It collects and aggregates log data from across an organization's entire IT infrastructure including servers, networks, security devices, operating systems and applications. Key capabilities of LogLogic include:Real-time log monitoring and analysis to detect anomalies and threatsInteractive search across...
OpenTSDB icon

OpenTSDB

OpenTSDB is an open source, distributed time series database written on top of HBase. It is specifically designed to store and serve massive amounts of time series data without losing granularity, making it well-suited for monitoring use cases that require high reliability and scalability.Some key features of OpenTSDB include:Scalability -...
OpenTSDB image
VividCortex icon

VividCortex

VividCortex is a comprehensive database monitoring and analytics platform designed specifically for MySQL, PostgreSQL, MongoDB, Redis, and other popular databases. It provides unparalleled visibility into your database workload, queries, performance issues, and trends.Key features of VividCortex include:Real-time monitoring of all database queries, with full query details and execution statisticsVisual explain...
VividCortex image
Axibase Time Series Database icon

Axibase Time Series Database

Axibase Time Series Database (ATSD) is an open-source time series database optimized for efficiently collecting, storing, analyzing, graphing, alerting, and visualizing numeric time series data from IT infrastructure, application management, industrial sensors, and financial systems.Unlike traditional SQL databases, ATSD employs a non-tabular design to organize time-stamped observations from thousands of...
Axibase Time Series Database image
Hosted Graphite icon

Hosted Graphite

Hosted Graphite is a Software-as-a-Service platform that provides cloud-based monitoring and observability for applications and infrastructure. It specializes in analyzing time-series data such as metrics, logs, and events to provide insights into performance, availability, and usage trends.Key features of Hosted Graphite include:Customizable dashboards for visualizing metrics and building graphsAlerting based...
Hosted Graphite image
TimeSeries.Guru icon

TimeSeries.Guru

TimeSeries.Guru is a comprehensive software for time series analysis and forecasting. It provides an easy-to-use interface for visualizing, exploring, analyzing, modeling, forecasting, and monitoring time series data.Some key features and capabilities include:Interactive visualizations like time series plots, seasonality plots, correlation plots, residual plots, etc.Decomposition of time series into trend, seasonality,...
Logscape icon

Logscape

Logscape is a log management and analytics platform designed to help IT teams aggregate, analyze, and visualize machine data from across their infrastructure and applications. Some key capabilities and benefits of Logscape include:Real-time log aggregation from physical servers, virtual machines, cloud platforms, containers, network devices, and more using lightweight agentsOut-of-the-box...
OTUS SIEM icon

OTUS SIEM

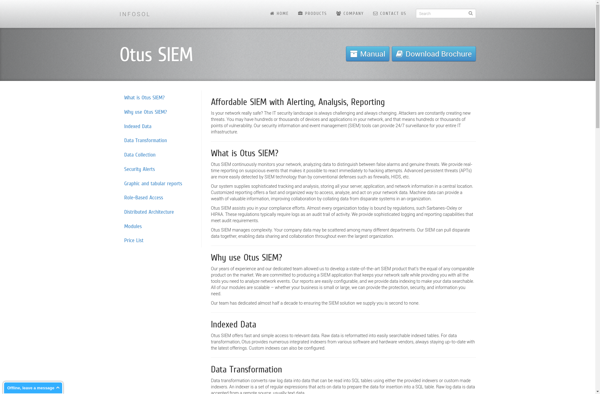
OTUS SIEM is a security information and event management platform purpose-built for enterprises that need to manage IT infrastructure at scale. It collects log and event data from across an organization's networks, endpoints, cloud services, and other systems.Powerful analytics help OTUS SIEM detect advanced threats and zero-day attacks while providing...
OTUS SIEM image
XpoLog icon

XpoLog

XpoLog is a comprehensive cloud-based logistics management software designed for shippers, third-party logistics providers (3PLs), freight brokers, and carriers. It features robust transportation management, warehouse management, order management, and inventory management tools to help streamline operations.Key capabilities and benefits of XpoLog include:Transportation management - automates planning, execution, tracking, and settlement...
XpoLog image
Loom Systems icon

Loom Systems

Loom Systems is an AI-powered IT operations (AIOps) platform designed to help enterprises monitor, analyze, and optimize their IT environments. The software uses machine learning and predictive analytics to provide actionable insights across infrastructure and applications.Key capabilities and benefits of Loom Systems include:Intelligent monitoring and alerting - Automatically detects anomalies...
ErrorFeed icon

ErrorFeed

ErrorFeed is a robust error and exception monitoring software used by developers and IT teams to track errors and crashes in web and mobile applications. It gives real-time alerting about app issues and integrates seamlessly with platforms like JavaScript, .NET, Java, Ruby, PHP and more.Key features include:Real-time error monitoring with...
ErrorFeed image
DeferPanic icon

DeferPanic

DeferPanic is an open-source error handling library for the Go programming language that focuses on gracefully handling panic errors. It was created to help Go developers easily wrap sections of code that may panic to prevent crashes and enable better error recovery.Some key features of DeferPanic include:Simple panic wrapping and...
DeferPanic image
DalmatinerDB icon

DalmatinerDB

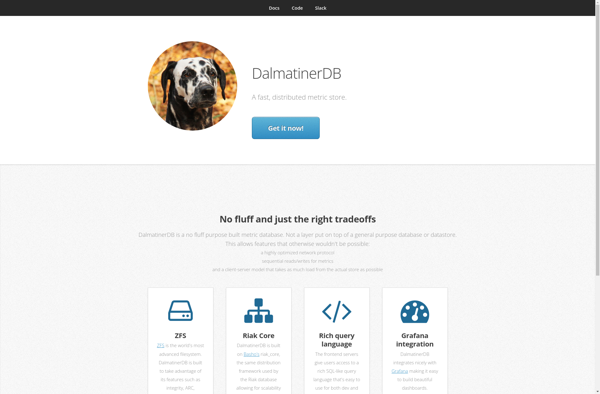
DalmatinerDB is an open-source, high-performance metrics database and time-series database (TSDB) written in Erlang. It is designed to collect, store and query large volumes of time-series data with millisecond precision.Some key features and benefits of DalmatinerDB include:Fast writes - Optimized to handle high velocity data with minimal latency. Can handle...
DalmatinerDB image
Chronix icon

Chronix

Chronix is an open-source time series database specifically optimized for storing and analyzing large amounts of time-stamped data such as metrics and diagnostic events generated by applications, systems, and devices. It was originally created by Florian Lautenschlager as part of his PhD research at the University of Konstanz in Germany.The...
Log Collector icon

Log Collector

Log Collector is a log management and analysis software that helps organizations aggregate log data from across their IT infrastructure into a centralized repository. It collects log data from servers, network devices, applications, cloud platforms, and more using built-in integrations or APIs.Once the log data is aggregated, Log Collector provides...
Log Collector image
Cube icon

Cube

Cube is an open-source workflow engine and automation platform that allows you to build, schedule, orchestrate and monitor workflows and jobs. Some key features of Cube include:Visual programming interface to build workflows by connecting blocksSupport for over 300 app integrations via built-in and custom blocksScheduling capabilities to run workflows on...
Cube image
Reconnoiter icon

Reconnoiter

Reconnoiter is an open-source monitoring and alerting tool optimized for operating efficiently at scale in production environments. It is designed to provide comprehensive monitoring for systems infrastructure and applications with minimal overhead.Some key capabilities and features of Reconnoiter include:Lightweight agent allowing efficient monitoring of thousands of systemsCustomizable checks and alerts...
Reconnoiter image