DalmatinerDB is a fast, distributed metrics database written in Erlang. It is optimized for storing time-series data like metrics and events. It can handle high volumes of writes with low latency.
DalmatinerDB is a fast, distributed metrics database written in Erlang. It is optimized for storing time-series data like metrics and events. It can handle high volumes of writes with low latency.
What is DalmatinerDB?
DalmatinerDB is an open-source, high-performance metrics database and time-series database (TSDB) written in Erlang. It is designed to collect, store and query large volumes of time-series data with millisecond precision.
Some key features and benefits of DalmatinerDB include:
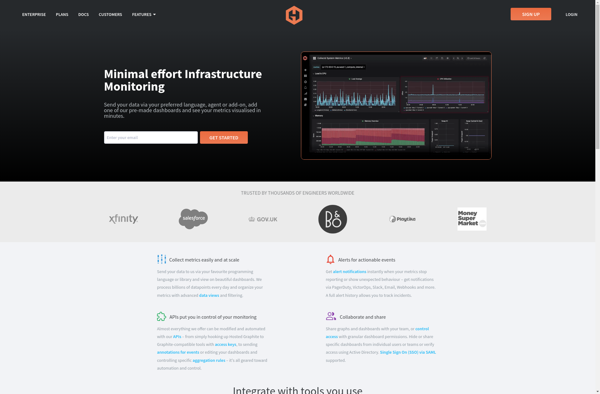
Fast writes - Optimized to handle high velocity data with minimal latency. Can handle hundreds of thousands of data points per second.
Scalability - Runs distributed on multiple nodes with automatic data partitioning and replication. Scales horizontally to handle increasing data volumes.
Reliability - Data is replicated for fault-tolerance. Continues operation during node failures or network partitions.
Query performance - Fast aggregation operations on large data sets. Uses probabilistic data structures for efficiency.
Ease of use - Intuitive query language and API bindings provided for various languages. Easy to set up and operate.
Visualization - Plays well with Grafana for building dashboards to visualize metrics.
Open source - Released under the LGPLv3 license. Transparent code and helpful community.
DalmatinerDB is well-suited for applications that need to collect, analyze and monitor high-frequency performance or business metrics at scale. Common use cases include infrastructure monitoring, IoT sensor data, network analytics, application performance management, business intelligence and analytics, etc.
DalmatinerDB Features
Features
Fast write throughput
Built-in sharding and replication
Query language for analyzing time-series data
HTTP API for writing and querying metrics
Plugins for ingesting data from various sources
Pricing
Open Source
Pros
Highly scalable and distributed architecture
Very fast writes for time-series data
Erlang runtime provides fault tolerance
Open source with permissive MIT license
Cons
Limited query capabilities compared to full-featured databases
Lacks some features of commercial time-series databases
Prometheus is an open source monitoring and alerting system optimized for containerized environments like Kubernetes. It provides real-time visibility into applications, infrastructure, and services running in an environment.Prometheus works by scraping and storing time series data from various systems and services. It collects metrics from targets using either a pull...
Grafana is a feature-rich, open source analytics and monitoring visualization suite. It integrates tightly with a variety of database technologies like Graphite, Prometheus, InfluxDB, Elasticsearch, and more to allow for easy exploration and visualization of time series data. Some key capabilities and benefits of Grafana include:Intuitive graphical UI makes it...
Grafana Loki is an open source logging aggregation system designed specifically for cloud native infrastructure. It is optimized for saving, indexing, and querying logs through labels and streams rather than unstructured text.Some key features of Grafana Loki include:Horizontally scalable - built on top of Prometheus's remote write protocol.Log queries -...
Graphite is an open-source monitoring and graphing tool used to store, visualize, and monitor time-series data from servers, applications, or other systems. It is designed to be highly scalable and robust for handling high volume metric collection and visualization.Some key features and components of Graphite include:Carbon - a high-performance service...
LogicMonitor is an infrastructure monitoring software platform that was founded in 2008. It is designed for modern, dynamic IT environments and provides organizations with visibility of their infrastructure performance and availability including networks, servers, applications and more across cloud, on-prem, hybrid and multi-cloud environments.Some key capabilities and benefits of LogicMonitor...
Axibase Time Series Database (ATSD) is an open-source time series database optimized for efficiently collecting, storing, analyzing, graphing, alerting, and visualizing numeric time series data from IT infrastructure, application management, industrial sensors, and financial systems.Unlike traditional SQL databases, ATSD employs a non-tabular design to organize time-stamped observations from thousands of...
Hosted Graphite is a Software-as-a-Service platform that provides cloud-based monitoring and observability for applications and infrastructure. It specializes in analyzing time-series data such as metrics, logs, and events to provide insights into performance, availability, and usage trends.Key features of Hosted Graphite include:Customizable dashboards for visualizing metrics and building graphsAlerting based...
TimeSeries.Guru is a comprehensive software for time series analysis and forecasting. It provides an easy-to-use interface for visualizing, exploring, analyzing, modeling, forecasting, and monitoring time series data.Some key features and capabilities include:Interactive visualizations like time series plots, seasonality plots, correlation plots, residual plots, etc.Decomposition of time series into trend, seasonality,...