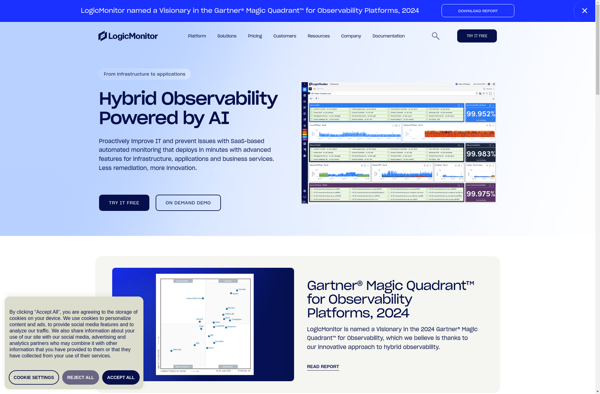
LogicMonitor is an infrastructure monitoring software designed for hybrid IT environments. It enables businesses to detect and respond to infrastructure issues quickly and maintain uptime. The software has features like automated discovery, predictive alerting and device manageme
LogicMonitor: Infrastructure Monitoring Software for Hybrid IT Environments
Detect infrastructure issues quickly, maintain uptime and optimize your hybrid IT environment with LogicMonitor's automated discovery, predictive alerting and device management features.
What is LogicMonitor?
LogicMonitor is an infrastructure monitoring software platform that was founded in 2008. It is designed for modern, dynamic IT environments and provides organizations with visibility of their infrastructure performance and availability including networks, servers, applications and more across cloud, on-prem, hybrid and multi-cloud environments.
Some key capabilities and benefits of LogicMonitor include:
Automated asset discovery and monitoring - The software has an auto-discovery engine that automatically finds IT infrastructure to be monitored.
Out-of-the-box monitoring support - It comes with over 1,200 configurable plugins to monitor various technologies including cloud platforms and services, databases, storage and more.
Unified visibility - Brings all monitoring data into a single pane of glass via customizable dashboards.
Predictive alerting - Uses machine learning to predict and alert on issues before they impact end users.
Flexible deployment models - Can be deployed as SaaS, managed service or on-premises.
Scalability - Handles large environments with complex and growing infrastructure needs.
Reporting and SLA management - Offers reporting capabilities to analyze trends and manage service level objectives.
API integrations - Integrates with other systems and tools via open APIs and connectors.
LogicMonitor aims to future-proof monitoring and make hybrid infrastructures more understandable, manageable, and reliable for businesses. With customizable reporting, predictive capabilities and flexible deployment options, it provides a scalable solution for businesses of all sizes.
LogicMonitor Features
Features
Automated discovery and monitoring of infrastructure components
Predictive alerting and anomaly detection
Real-time performance and availability monitoring
Customizable dashboards and reporting
IT infrastructure management and device management
Cloud monitoring for public, private, and hybrid environments
Integrations with various IT tools and services
Pricing
Subscription-Based
Pros
Comprehensive monitoring across on-premises and cloud environments
Proactive alerting and automated remediation capabilities
Customizable dashboards and reporting for better visibility
Scalable and flexible to accommodate growing infrastructure
Ease of deployment and use with minimal setup required
Cons
Relatively higher pricing compared to some other monitoring solutions
Limited free trial period for evaluation
Some advanced features may require higher pricing tiers
Datadog is a SaaS-based monitoring and analytics platform for cloud applications. It provides complete visibility into dynamic infrastructures by aggregating metrics, events, and logs from servers, containers, databases, tools, and services. This allows Dev and Ops teams to quickly solve performance problems, prove the root cause of software bugs, spot...
New Relic is a comprehensive application performance monitoring and observability platform used by software engineers to monitor, troubleshoot, and optimize their applications and infrastructure. It provides real-time visibility into the performance, health, and usage of applications running in cloud, hybrid, and on-premises environments.Key features of New Relic include:Application monitoring -...
Zabbix is an enterprise-class open source distributed monitoring solution for networks and applications. It is designed to monitor and track the status of various network services, servers, and other network hardware. It provides real-time graphing, alerting, visualization and reporting for monitoring IT infrastructure performance and availability.Some of the key features...
Paessler PRTG Network Monitor is a powerful and comprehensive infrastructure and network monitoring software. It can monitor a wide range of IT infrastructure components and network devices including:Servers (Windows, Linux, UNIX, etc.)Network devices like routers, switches, firewallsVirtualization platforms like VMware and Hyper-VWebsites and web applicationsCloud services like AWS, Azure, and...
Nagios is an open source computer system and network monitoring software application. It watches hosts and services, sends notifications when things go wrong, and alerts users when issues come up. Nagios helps system administrators detect and resolve IT infrastructure problems before they affect critical business processes.Some key capabilities of Nagios...
Spiceworks is a free, ad-supported IT management software suite aimed at small and mid-size businesses. It includes a variety of features to help IT professionals monitor, manage, and troubleshoot their infrastructure and technology stack.Key features of Spiceworks include:Network monitoring and alertsInventory management and reportingIntegrated help desk and ticketing systemClient monitoring...
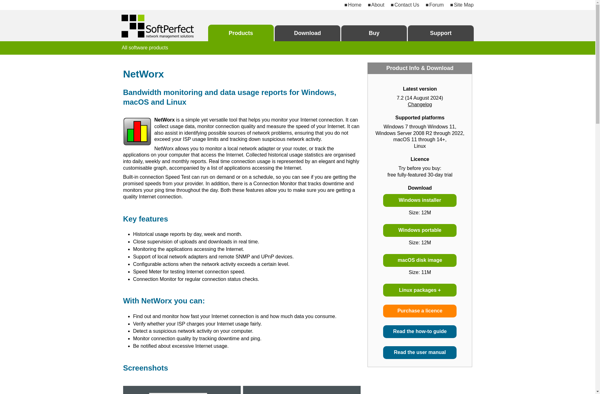
NetWorx is a comprehensive and easy-to-use network monitoring software for Windows. It allows users to analyze all inbound and outbound network traffic and measure internet data usage and speeds.Some key features of NetWorx include:Track total bandwidth usage and log detailed usage statistics per applicationSet bandwidth allowances and alerts for individual...
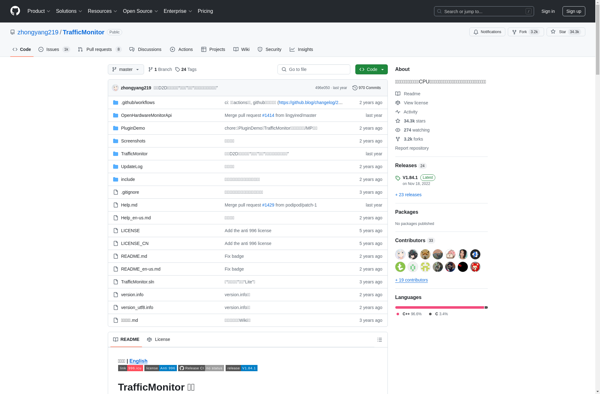
TrafficMonitor is a user-friendly web analytics platform for monitoring and analyzing website traffic and visitor behavior. It provides website owners, marketers, and analysts with in-depth intelligence to make data-driven decisions.With TrafficMonitor, you can track key metrics like visit volume, visitor geographic location, page views, bounce rates, referral websites, popular site...
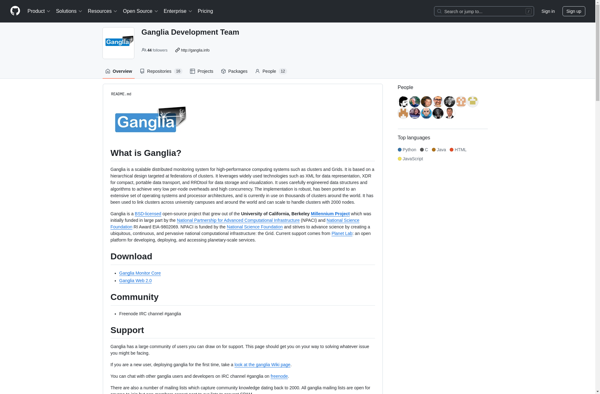
Ganglia is a scalable distributed monitoring system for high-performance computing systems such as clusters and grids. It allows users to visualize various performance metrics like CPU load, memory usage, network traffic, disk I/O in real-time through easy to understand graphical web interfaces.Some of the key features of Ganglia include:Lightweight and...
System Center Operations Manager (SCOM) is a systems monitoring and management software developed by Microsoft. It is part of the Microsoft System Center suite of management products.SCOM allows IT administrators to monitor services, devices and operations across on-premises, cloud and hybrid environments. It provides a centralized view to oversee the...
Munin is a free and open source resource monitoring software designed to monitor computer systems and networks. It tracks resource usage, performance, and trends over time and generates graphical representations of the collected data.Some key features of Munin include:Monitoring of system resources like CPU usage, disk usage, memory, network bandwidth,...
Remote Desktop Commander Suite is a comprehensive remote access and administration suite for Windows. It allows IT professionals, support technicians, and power users to manage multiple computers from a single interface.Some key features of Remote Desktop Commander Suite include:Remote control - View and control remote PCs in real-time with various...
Amazon CloudWatch is a monitoring and management service that provides data and actionable insights for AWS resources and applications. CloudWatch delivers metrics, logs, and events to help developers, operations engineers, and IT managers understand how the components of their applications and infrastructure are performing so they can optimize for efficiency,...
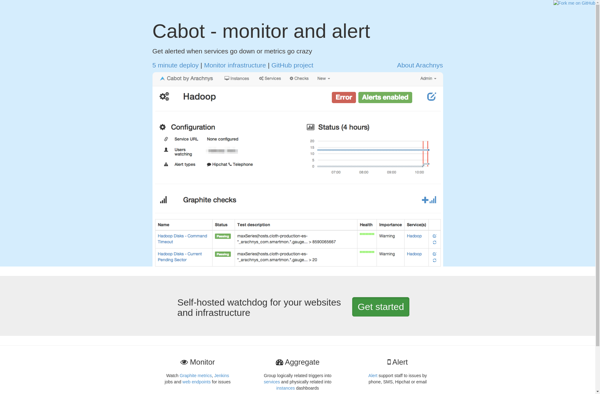
Cabot is an open-source infrastructure monitoring and alerting tool designed specifically for modern cloud environments and containers. It allows users to easily configure alerts and notifications for their services and applications, as well as visualize their overall health.Some key features of Cabot include:Flexible alerting rules based on a variety of...
Xymon is an open-source monitoring and alerting tool designed to keep track of the availability, performance, and health of IT infrastructure components like servers, networks, web applications, and services. It provides a centralized way to monitor the status of systems across an organization's entire IT ecosystem.Some key capabilities and features...
Shinken is an open source monitoring framework that is a drop-in replacement for Nagios Core. It offers several key advantages over Nagios:Scalability - Shinken is designed to scale to very large environments with tens of thousands of hosts and services. It has a distributed architecture and can be deployed across...
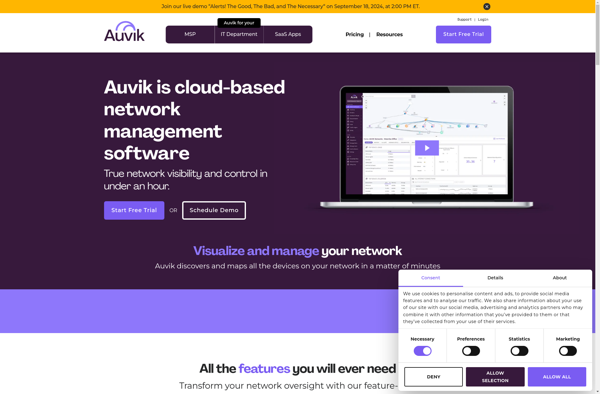
Auvik is a cloud-based network management platform that enables IT service providers, internal IT teams, and network engineers to monitor, manage, and optimize their clients' on-premise and cloud network infrastructure. Auvik provides deep visibility into network infrastructure and workloads by automatically discovering network devices, mapping network topology, monitoring device configurations,...
NodeQuery is an open-source Java library that provides an easy way to query graph databases like Neo4j. It uses a fluent API to construct Cypher queries, allowing developers to retrieve nodes and relationships from the graph without writing raw Cypher.Some key features of NodeQuery include:Fluent API for constructing database queriesSupports...
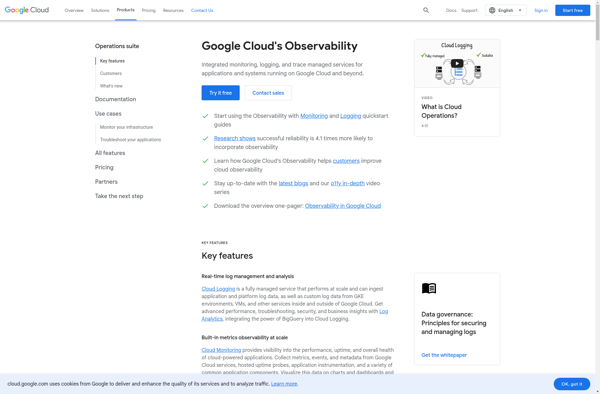
Stackdriver is a cloud-based monitoring, logging, and diagnostics platform offered by Google Cloud. It provides performance monitoring, uptime checking, dashboards, alerting, log management, and troubleshooting capabilities for cloud services and applications running on Google Cloud Platform, Amazon Web Services, and on-premises environments.Key capabilities and features of Stackdriver include:Monitoring of metrics...
BigPanda is an IT operations management platform powered by AIOps and machine learning capabilities for modern digital businesses. It helps optimize IT Ops by improving incident management, increasing visibility across the IT environment, and reducing mean time to resolution.Some key capabilities and benefits of BigPanda include:Event correlation and noise reduction...
cfxPulse is a comprehensive visual effects and animation software tailored for the film, television and media content creation industry. It provides a flexible node-based interface to build complex effect shots involving simulations, particles, fluids, destruction and other dynamics.Some key features of cfxPulse include:Powerful solvers for physics simulations of smoke, fire,...
Hyperic is an open source IT management and monitoring software designed to provide broad visibility and control across physical, virtual and cloud environments. It can automatically discover infrastructure and applications, measure availability and performance, detect problems, correlate events and facilitate rapid troubleshooting.Key features of Hyperic include:Automatic discovery and mapping of...
Concurix is an open-source automated testing platform designed for software developers. It allows dev teams to systematically test product features and measure performance to improve software quality over time.Key capabilities include:Automated testing of application features to detect regressionsPerformance tracking of features like page load times, API calls, etc.Dashboards and alerts...
SteelCentral is a comprehensive network and application performance monitoring platform designed by Riverbed Technology. It provides end-to-end visibility into network and application performance to help IT teams quickly identify and troubleshoot issues before they impact end users and the business.Key capabilities and benefits of SteelCentral include:Unified visibility - Get a...
Uptrends Infra is a comprehensive infrastructure and application monitoring platform designed for IT operations, DevOps teams, and web developers. It provides a single pane of glass to monitor the uptime, performance, and health of essential infrastructure and applications.Key features of Uptrends Infra include:Uptime Monitoring - Monitor website and application availability...
Tivoli Business Service Manager (TBSM) is an IT service management software solution from IBM. It helps organizations manage, monitor and optimize their IT services and infrastructure to improve quality of service and availability.Key features and capabilities of Tivoli Business Service Manager include:Discovery and visualization - Automatically discovers IT infrastructure components...
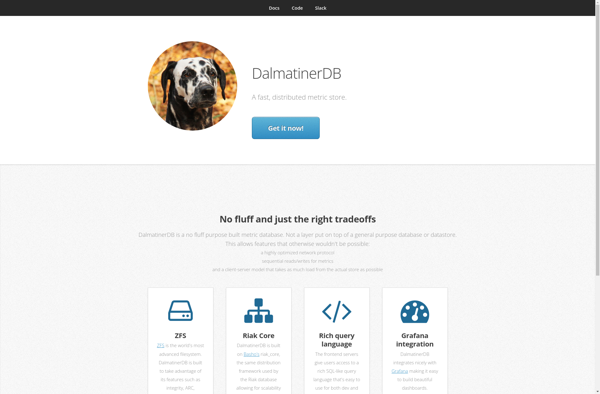
DalmatinerDB is an open-source, high-performance metrics database and time-series database (TSDB) written in Erlang. It is designed to collect, store and query large volumes of time-series data with millisecond precision.Some key features and benefits of DalmatinerDB include:Fast writes - Optimized to handle high velocity data with minimal latency. Can handle...
javOSize is an open source Java profiler designed to analyze memory usage and object allocation in Java applications. It provides useful insights for Java developers to understand and optimize their application's memory utilization.Key features of javOSize include:Detailed reporting on memory consumption, including per-class and package breakdownsTracking of object allocation rates...
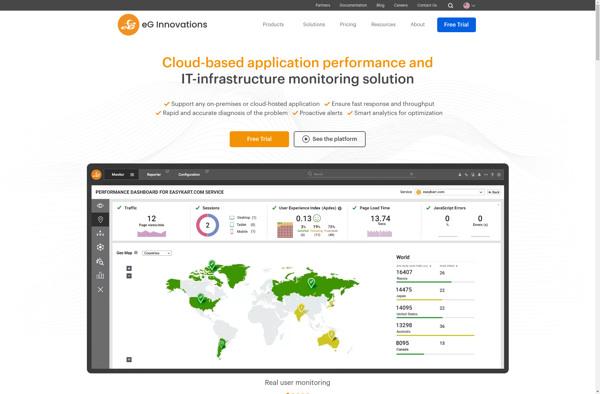
eG Enterprise is a unified IT performance monitoring and analytics platform designed to provide end-to-end visibility across infrastructure, applications, and end-user experience. Some key capabilities include:Automatic discovery of the entire IT environment including physical, virtual, cloud, container, and hybrid infrastructure.Building automated topology and dependency maps to enable rapid root cause...