Ganglia is an open-source monitoring system for high-performance computing systems such as clusters and grids. It collects and visualizes various metrics like CPU utilization, memory usage, network traffic etc. in real-time. It allows for easy identification of bottlenecks and fa
An open-source monitoring system for high-performance computing, collecting and visualizing metrics like CPU utilization, memory usage & network traffic in real-time.
What is Ganglia?
Ganglia is a scalable distributed monitoring system for high-performance computing systems such as clusters and grids. It allows users to visualize various performance metrics like CPU load, memory usage, network traffic, disk I/O in real-time through easy to understand graphical web interfaces.
Some of the key features of Ganglia include:
Lightweight and low resource utilization for minimal impact on the monitored systems
Optimized for monitoring clusters and grids with thousands of nodes
Multi-threaded and optimized data collection for high efficiency
Flexible and customizable metrics and visualization
Hierarchical design for federating clusters and scalability
Cross-platform support including Linux, BSD, and more
By collecting and tracking metrics over time, Ganglia enables easy identification of bottlenecks, faults and anomalies in clusters. This helps optimize performance and utilization. The visualization and insight it provides into distributed systems makes Ganglia an indispensable monitoring tool for system administrators and HPC professionals.
Ganglia Features
Features
Real-time monitoring of clusters and grids
Collection of metrics like CPU usage, memory usage, network traffic
Visualization of metrics through web interface
Alerting based on thresholds
Support for heterogeneous clusters with different architectures
Datadog is a SaaS-based monitoring and analytics platform for cloud applications. It provides complete visibility into dynamic infrastructures by aggregating metrics, events, and logs from servers, containers, databases, tools, and services. This allows Dev and Ops teams to quickly solve performance problems, prove the root cause of software bugs, spot...
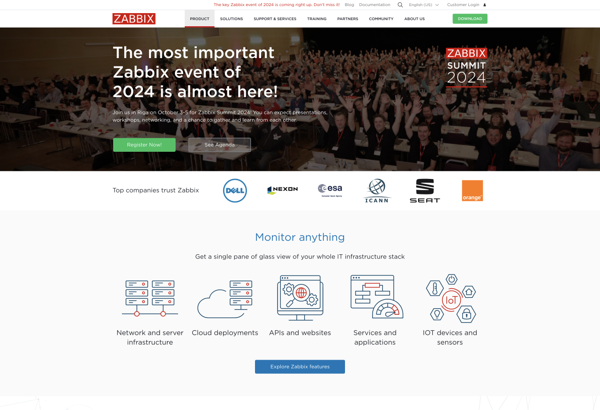
Zabbix is an enterprise-class open source distributed monitoring solution for networks and applications. It is designed to monitor and track the status of various network services, servers, and other network hardware. It provides real-time graphing, alerting, visualization and reporting for monitoring IT infrastructure performance and availability.Some of the key features...
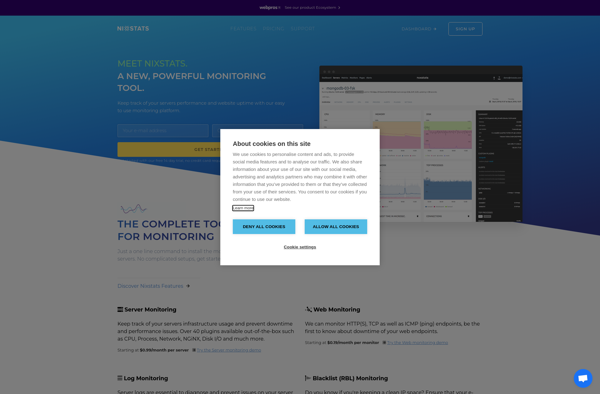
NIXStats is an open-source web analytics application that allows website owners to track and analyze traffic to their sites. It provides detailed statistics on visits, unique visitors, page views, bounce rates, traffic sources, and more. As an open-source platform, NIXStats places no restrictions on data collection or analysis and avoids...
Munin is a free and open source resource monitoring software designed to monitor computer systems and networks. It tracks resource usage, performance, and trends over time and generates graphical representations of the collected data.Some key features of Munin include:Monitoring of system resources like CPU usage, disk usage, memory, network bandwidth,...
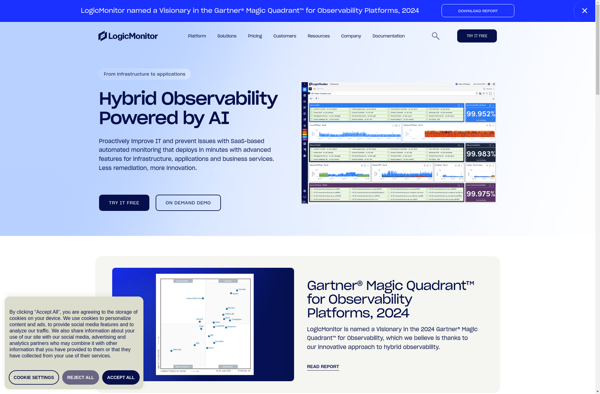
LogicMonitor is an infrastructure monitoring software platform that was founded in 2008. It is designed for modern, dynamic IT environments and provides organizations with visibility of their infrastructure performance and availability including networks, servers, applications and more across cloud, on-prem, hybrid and multi-cloud environments.Some key capabilities and benefits of LogicMonitor...
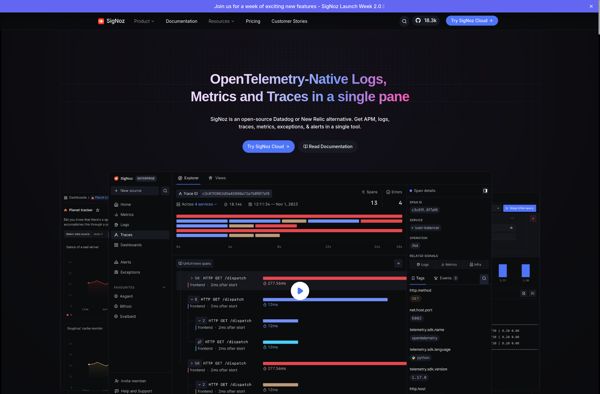
SigNoz is an open-source alternative to commercial Application Performance Monitoring (APM) tools like DataDog, New Relic, and Dynatrace. It is a cloud-native observability platform designed specifically for monitoring modern distributed systems.Some key capabilities and benefits of SigNoz include:Lightweight and optimized for microservices, serverless, and Kubernetes environmentsCollects metrics, traces, and logs...
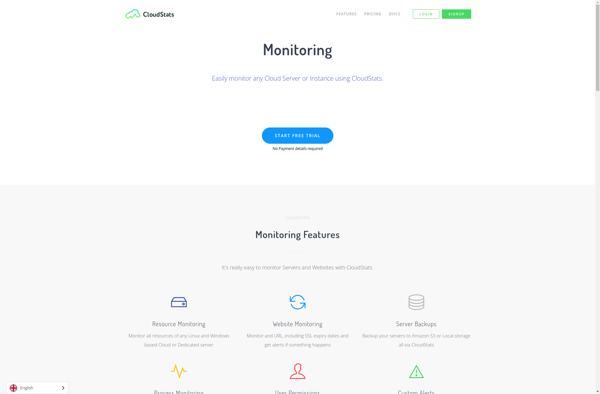
CloudStats is a comprehensive cloud monitoring and analytics platform designed to provide complete visibility into infrastructure and application performance across public, private, and hybrid cloud environments. It is an all-in-one solution for cloud cost management, usage analytics, health monitoring, and log analytics.Key features of CloudStats include:Custom dashboarding to visualize critical...
Axibase Time Series Database (ATSD) is an open-source time series database optimized for efficiently collecting, storing, analyzing, graphing, alerting, and visualizing numeric time series data from IT infrastructure, application management, industrial sensors, and financial systems.Unlike traditional SQL databases, ATSD employs a non-tabular design to organize time-stamped observations from thousands of...
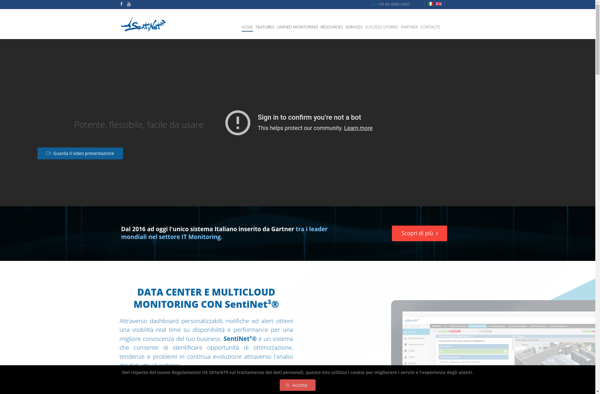
Sentinet3 is a comprehensive network monitoring and analytics solution that provides visibility and insight across the network infrastructure. It features:Automated asset discovery to create an inventory of network devices, including switches, routers, servers, devices, and more.Network topology mapping to visualize the connections and interdependencies between infrastructure components.Real-time performance monitoring for...