CloudStats is a cloud monitoring and analytics platform that provides visibility into infrastructure and application performance. It offers real-time metrics, log analysis, and visualization tools to help optimize cloud costs, usage, and health.
CloudStats: Cloud Monitoring and Analytics Platform
CloudStats is a cloud monitoring and analytics platform that provides visibility into infrastructure and application performance. It offers real-time metrics, log analysis, and visualization tools to help optimize cloud costs, usage, and health.
What is CloudStats?
CloudStats is a comprehensive cloud monitoring and analytics platform designed to provide complete visibility into infrastructure and application performance across public, private, and hybrid cloud environments. It is an all-in-one solution for cloud cost management, usage analytics, health monitoring, and log analytics.
Key features of CloudStats include:
Custom dashboarding to visualize critical metrics and logs in real-time
Alerting and anomaly detection to identify issues proactively
Cloud cost tracking and rightsizing recommendations to optimize spending
Integration with all major cloud providers like AWS, Azure, and GCP
Support for containers, serverless, and microservices architectures
Flexible querying and powerful data exploration tools
Collaboration features to share dashboards and insights across teams
Unlike native cloud tools, CloudStats provides a unified view across multi-cloud and on-prem environments. It enables DevOps, site reliability engineers, and cloud architects to monitor, troubleshoot, and optimize cloud usage and spend from a single pane of glass.
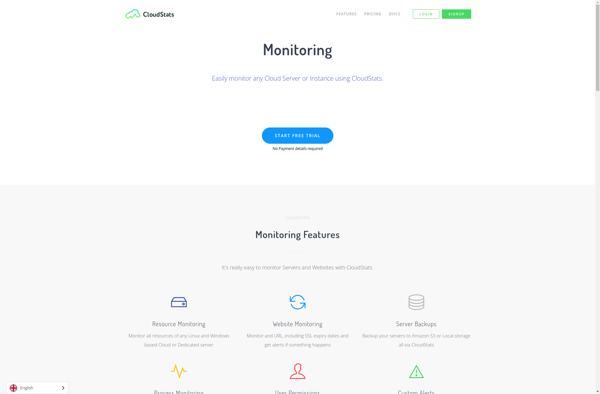
CloudStats Features
Features
Real-time metrics and log monitoring
Customizable dashboards and alerts
Resource optimization and cost management
Anomaly detection and root cause analysis
Integrations with AWS, Azure, GCP, etc
Pricing
Subscription-Based
Pay-As-You-Go
Custom Pricing
Pros
Comprehensive visibility into cloud infrastructure
Powerful analytics and visualization
Optimization of cloud costs and resources
Easy to set up and use
Flexible and scalable
Cons
Can be complex for non-technical users
Limited support for on-prem infrastructure
Additional fees for some advanced features
May require professional services for full implementation
Datadog is a SaaS-based monitoring and analytics platform for cloud applications. It provides complete visibility into dynamic infrastructures by aggregating metrics, events, and logs from servers, containers, databases, tools, and services. This allows Dev and Ops teams to quickly solve performance problems, prove the root cause of software bugs, spot...
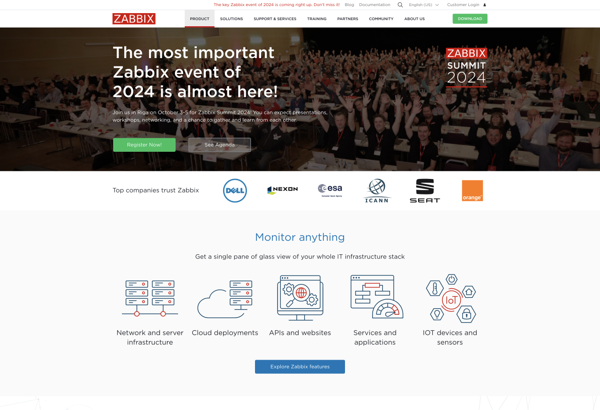
Zabbix is an enterprise-class open source distributed monitoring solution for networks and applications. It is designed to monitor and track the status of various network services, servers, and other network hardware. It provides real-time graphing, alerting, visualization and reporting for monitoring IT infrastructure performance and availability.Some of the key features...
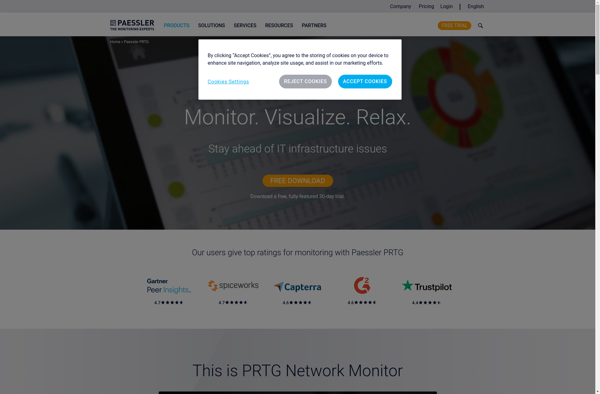
Paessler PRTG Network Monitor is a powerful and comprehensive infrastructure and network monitoring software. It can monitor a wide range of IT infrastructure components and network devices including:Servers (Windows, Linux, UNIX, etc.)Network devices like routers, switches, firewallsVirtualization platforms like VMware and Hyper-VWebsites and web applicationsCloud services like AWS, Azure, and...
Nagios is an open source computer system and network monitoring software application. It watches hosts and services, sends notifications when things go wrong, and alerts users when issues come up. Nagios helps system administrators detect and resolve IT infrastructure problems before they affect critical business processes.Some key capabilities of Nagios...
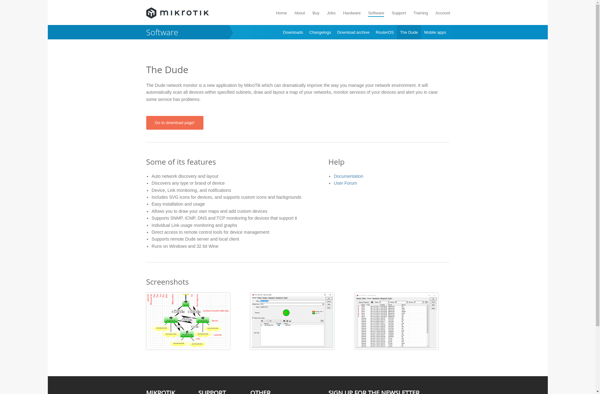
The Dude is a free network monitoring tool created by MikroTik for Windows, MacOS, and Linux systems. It allows network administrators to graphically monitor their networks and be alerted when issues occur.Some key features of The Dude include:Automatic discovery of network devices like routers, switches, servers, printers, etc.Tracking of device...
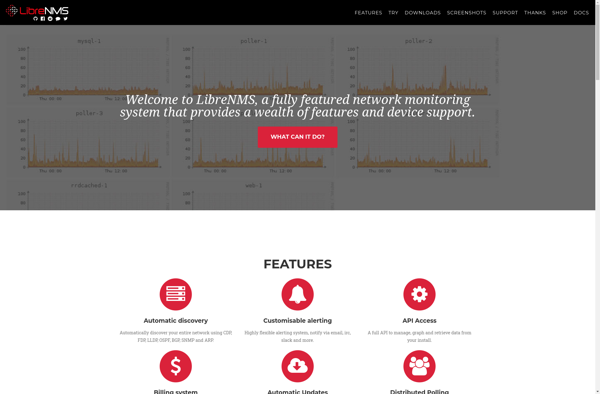
LibreNMS is an open source network monitoring system for monitoring servers, switches, printers, routers and other network devices. It has auto-discovery capabilities to automatically detect devices on the network and start monitoring them without the need for manual configuration.Some key features of LibreNMS include:Auto-discovery of network devicesSupport for a wide...
Spiceworks is a free, ad-supported IT management software suite aimed at small and mid-size businesses. It includes a variety of features to help IT professionals monitor, manage, and troubleshoot their infrastructure and technology stack.Key features of Spiceworks include:Network monitoring and alertsInventory management and reportingIntegrated help desk and ticketing systemClient monitoring...
Ganglia is a scalable distributed monitoring system for high-performance computing systems such as clusters and grids. It allows users to visualize various performance metrics like CPU load, memory usage, network traffic, disk I/O in real-time through easy to understand graphical web interfaces.Some of the key features of Ganglia include:Lightweight and...
Icinga is an open source monitoring system which checks the availability of your network resources, notifies users of outages, and generates performance data for reporting. It is a fork of the popular Nagios monitoring system and aims to improve upon some of its shortcomings.Some key features of Icinga include:Monitoring of...
Munin is a free and open source resource monitoring software designed to monitor computer systems and networks. It tracks resource usage, performance, and trends over time and generates graphical representations of the collected data.Some key features of Munin include:Monitoring of system resources like CPU usage, disk usage, memory, network bandwidth,...
Nagwin is an open source network and infrastructure monitoring tool designed specifically for Windows environments. It provides system administrators and IT professionals an integrated way to monitor the health and performance of their Windows servers, network devices, services, and applications.Key features of Nagwin include:Automatic discovery of Windows infrastructure and drawing...
Eyes Of Network is an open source network monitoring and management software that gives visibility into network infrastructure and performance. It helps monitor availability, bandwidth usage, latency, and other metrics across local area networks, switches, routers, servers, and other devices.Key features of Eyes Of Network include:Auto-discovery of network devicesCustomizable dashboards...
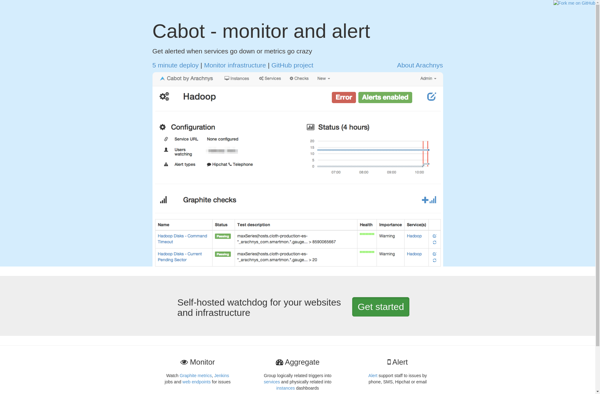
Cabot is an open-source infrastructure monitoring and alerting tool designed specifically for modern cloud environments and containers. It allows users to easily configure alerts and notifications for their services and applications, as well as visualize their overall health.Some key features of Cabot include:Flexible alerting rules based on a variety of...
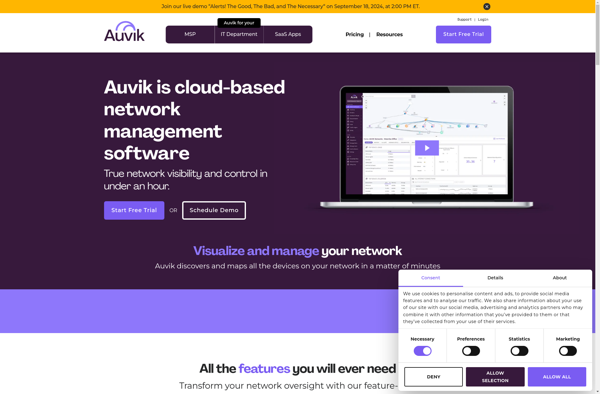
Auvik is a cloud-based network management platform that enables IT service providers, internal IT teams, and network engineers to monitor, manage, and optimize their clients' on-premise and cloud network infrastructure. Auvik provides deep visibility into network infrastructure and workloads by automatically discovering network devices, mapping network topology, monitoring device configurations,...
ElastAlert is an open-source Python rules engine designed for alerting on anomalies, spikes, or other patterns of interest in time series data stored in Elasticsearch. It provides an easy way to create and manage alerts for time series data without writing complex queries or scripts.Some key features of ElastAlert include:Flexible...
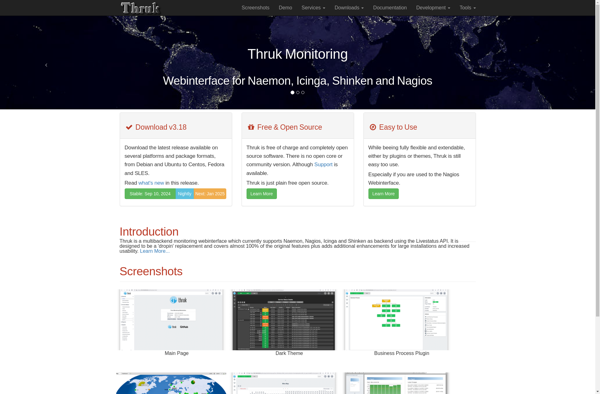
Thruk is an open-source monitoring web interface optimized for speed and customization. It works with multiple monitoring backends like Nagios, Icinga, Shinken and Naemon to provide access to current and historical monitoring status information.Some key features of Thruk include:A fast in-memory back-end for displaying status informationSupport for themeing and customization...
A Linux temperature web monitor is a software application designed to display temperature sensor data from a Linux computer through a web browser interface. It works by collecting readings from hardware temperature probes and sensors inside the Linux system, including the CPU, GPU, motherboard and hard drives.The temperature readings are...
VirtualMetric is a comprehensive server and infrastructure monitoring platform designed to provide granular visibility and actionable insights across complex, hybrid IT environments. It enables DevOps, site reliability engineers, and IT operations teams to track, analyze, and visualize key performance metrics in order to optimize infrastructure, application delivery, and end-user experience.Key...
Bosun is an open-source monitoring and alerting system created by Stack Exchange. It is designed to monitor, analyze, and alert on time-series data from databases, metrics systems, web servers, and other systems that output numeric data over time.Some key features of Bosun include:Flexible query language (SQRL) to search, filter, aggregate,...
Alignak is an open source monitoring framework designed to monitor IT infrastructure components such as network devices, servers, applications, and services. It is developed in Python and licensed under the Affero GPL v3 license.Alignak is compatible with Nagios so it can reuse existing Nagios plugins and configurations. This makes it...
Monometric.IO is a powerful yet easy-to-use server and infrastructure monitoring solution designed for modern IT teams. It provides real-time visibility into the health, performance, and availability of servers, websites, applications, and more.Key features include:Customizable dashboards showing key infrastructure metrics and statusAutomatic detection and monitoring of servers and cloud resourcesFlexible alerting...