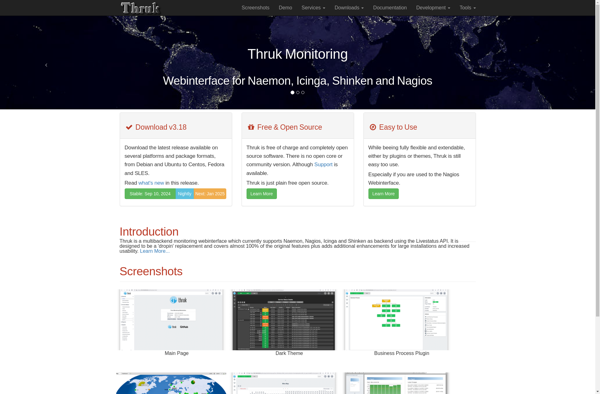
Thruk
Thruk is an open source monitoring web interface that supports multiple monitoring backends like Nagios, Icinga, Shinken and Naemon. It provides fast access to status information and allows easy configuration of hosts and services.
Thruk: Open Source Monitoring Web Interface
Open source monitoring web interface supporting Nagios, Icinga, Shinken, Naemon & more, with fast status access and easy host/service config.
What is Thruk?
Thruk is an open-source monitoring web interface optimized for speed and customization. It works with multiple monitoring backends like Nagios, Icinga, Shinken and Naemon to provide access to current and historical monitoring status information.
Some key features of Thruk include:
- A fast in-memory back-end for displaying status information
- Support for themeing and customization of the interface
- Quick searches and filtering of hosts and services
- Visualization of host, service and metric data
- Embedded graphs and reporting
- Configuration editors for hosts, services, contacts
- Supports multitenancy for separating views
- High availability mode with failover
- Readonly accounts for safe access
- RESTful interface for automation
Thruk is a good option for teams that want a highly customizable and responsive interface optimized for managing monitoring environments with thousands of hosts and services.
Thruk Features
Features
- Web-based interface for monitoring systems and services
- Supports Nagios, Icinga, Shinken and Naemon backends
- Customizable dashboards and views
- Alerting and notification options
- Reporting and SLA reporting
- Trends and analytics
- Support for distributed monitoring environments
Pricing
- Open Source
Pros
Open source and free
Easy to set up and configure
Very customizable and flexible
Good community support
Scalable for large environments
Integrates well with major monitoring tools
Cons
Can have a steep learning curve
Limitations with more advanced features
Some backend dependencies
May need programming knowledge for customization
Official Links
Reviews & Ratings
Login to ReviewThe Best Thruk Alternatives
View all Thruk alternatives with detailed comparison →
Top Network & Admin and Monitoring and other similar apps like Thruk
Here are some alternatives to Thruk:
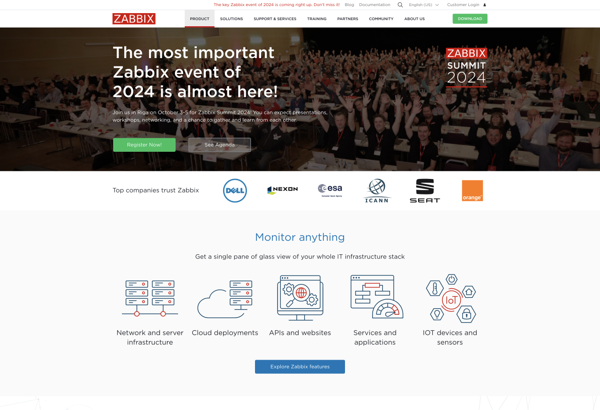
Suggest an alternative ❐Zabbix
Zabbix is an enterprise-class open source distributed monitoring solution for networks and applications. It is designed to monitor and track the status of various network services, servers, and other network hardware. It provides real-time graphing, alerting, visualization and reporting for monitoring IT infrastructure performance and availability.Some of the key features...
Nagios
Nagios is an open source computer system and network monitoring software application. It watches hosts and services, sends notifications when things go wrong, and alerts users when issues come up. Nagios helps system administrators detect and resolve IT infrastructure problems before they affect critical business processes.Some key capabilities of Nagios...

Icinga
Icinga is an open source monitoring system which checks the availability of your network resources, notifies users of outages, and generates performance data for reporting. It is a fork of the popular Nagios monitoring system and aims to improve upon some of its shortcomings.Some key features of Icinga include:Monitoring of...

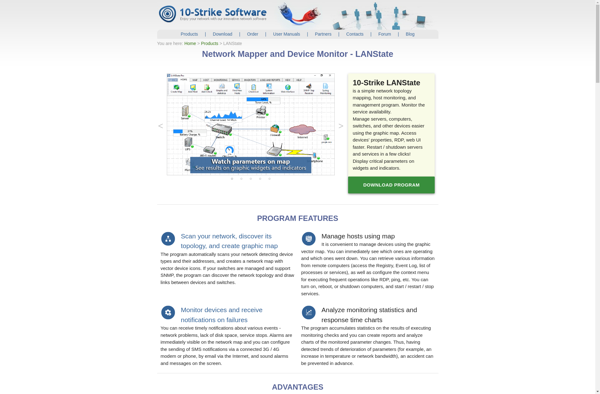
LANState
LANState is a network monitoring and management software designed specifically for local area networks (LANs) in businesses and organizations. It provides a centralized way for network administrators to visualize the status, performance, and connections across the LAN in real time.Key features of LANState include:Automatic discovery of devices on the LAN...
Trafikito
Trafikito is a comprehensive digital marketing suite designed to help website owners, marketers, and agencies better understand and improve the traffic to their sites. Some key features of Trafikito include:Website traffic analytics - In-depth reporting on visits, Unique visitors, page views, bounce rates, conversion rates, and more. Integrates with Google...
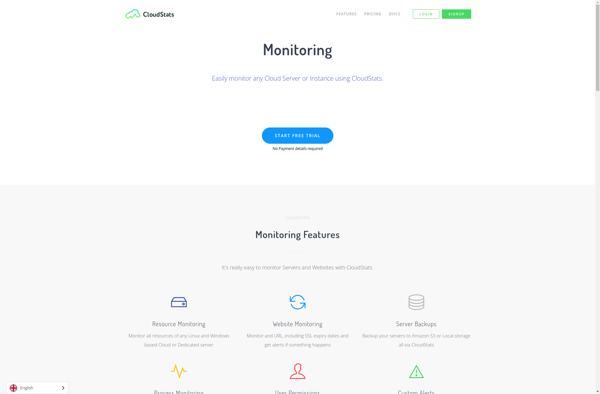
CloudStats
CloudStats is a comprehensive cloud monitoring and analytics platform designed to provide complete visibility into infrastructure and application performance across public, private, and hybrid cloud environments. It is an all-in-one solution for cloud cost management, usage analytics, health monitoring, and log analytics.Key features of CloudStats include:Custom dashboarding to visualize critical...
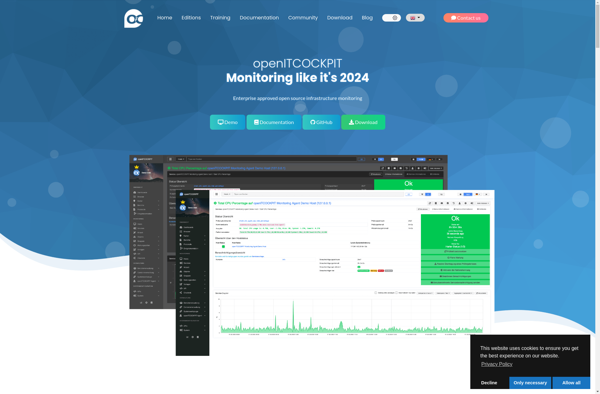
OpenITCOCKPIT
openITCOCKPIT is an open source, web-based IT management and monitoring platform. It provides monitoring capabilities for networks, servers, applications, services, virtual environments and more. Some key features include:Intuitive dashboard for viewing system statusMonitoring modules for Linux, Windows, SNMP, VMware, Docker and moreCustomizable alerts and notifications via email, Slack, Telegram etc.Visual...
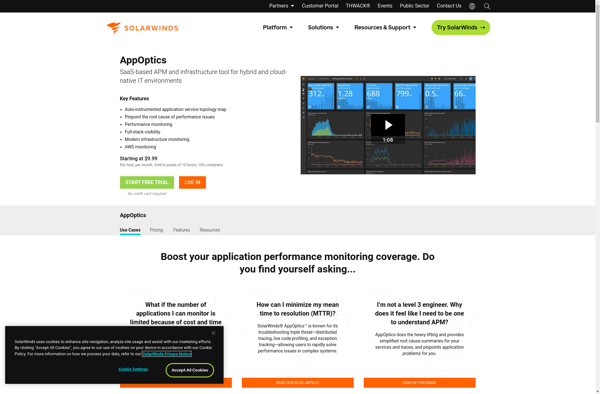
AppOptics
AppOptics is a cloud-based application performance monitoring (APM) platform designed for monitoring the performance and availability of cloud applications in real-time. It was acquired by SolarWinds in 2016.AppOptics provides distributed tracing, custom metrics, pre-defined integrations, alerting, and visualization capabilities to gain visibility into application performance across complex, distributed architectures. Key...