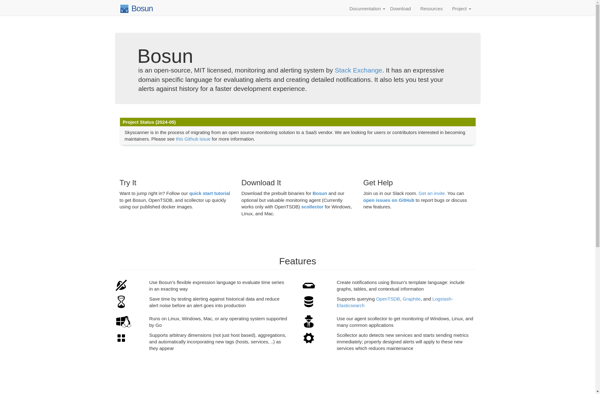
Bosun is an open-source monitoring and alerting system created by Stack Exchange. It is designed to monitor and alert on time-series data from systems like databases, metrics systems, and web servers.
Open-source monitoring and alerting system for time-series data from databases, metrics systems, and web servers, created by Stack Exchange
What is Bosun?
Bosun is an open-source monitoring and alerting system created by Stack Exchange. It is designed to monitor, analyze, and alert on time-series data from databases, metrics systems, web servers, and other systems that output numeric data over time.
Some key features of Bosun include:
Flexible query language (SQRL) to search, filter, aggregate, and transform time-series data
Customizable alerts and notifications via email, SMS, chat apps, etc.
Integration with commonly used data sources like Graphite, OpenTSDB, InfluxDB, etc.
Custom dashboard creation for data visualization
Anomaly detection algorithms to automatically detect issues
EXTENSIBLE plugin architecture to add new functionality and data sources
Bosun was created to meet the complex monitoring needs of Stack Exchange's large-scale production infrastructure. It offers more advanced analytics and customizability than many commercial monitoring tools. The open-source model also allows users to extend Bosun to fit their specific use cases.
While the configuration and use of Bosun has a learning curve, it is a very powerful and scalable monitoring system for organizations with complex infrastructures and monitoring needs.
Bosun Features
Features
Open-source monitoring and alerting system
Built-in expression language for creating alerts and notifications
Graphite integration for storing and querying time-series data
Web UI and REST API for configuring dashboards, alerts and notifications
Support for tagging metrics and grouping them together
Plugin architecture for adding new datasources and notification channels
Pricing
Open Source
Pros
Free and open-source
Flexible alerting and notification options
Easy to get up and running for monitoring basics
Good integration with Graphite for storing time-series data
Active open source community
Cons
Limited dashboard customization compared to other tools
Steeper learning curve than other open source options
Datadog is a SaaS-based monitoring and analytics platform for cloud applications. It provides complete visibility into dynamic infrastructures by aggregating metrics, events, and logs from servers, containers, databases, tools, and services. This allows Dev and Ops teams to quickly solve performance problems, prove the root cause of software bugs, spot...
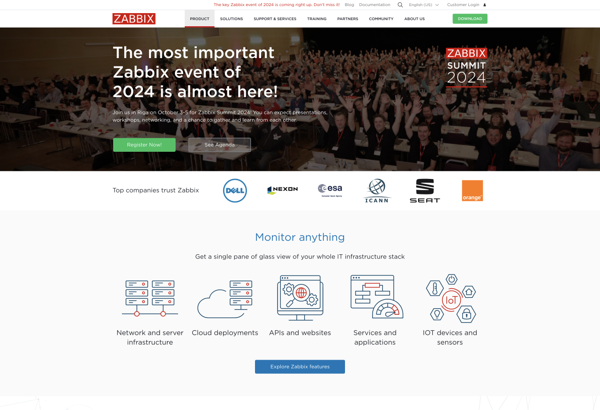
Zabbix is an enterprise-class open source distributed monitoring solution for networks and applications. It is designed to monitor and track the status of various network services, servers, and other network hardware. It provides real-time graphing, alerting, visualization and reporting for monitoring IT infrastructure performance and availability.Some of the key features...
Nagios is an open source computer system and network monitoring software application. It watches hosts and services, sends notifications when things go wrong, and alerts users when issues come up. Nagios helps system administrators detect and resolve IT infrastructure problems before they affect critical business processes.Some key capabilities of Nagios...
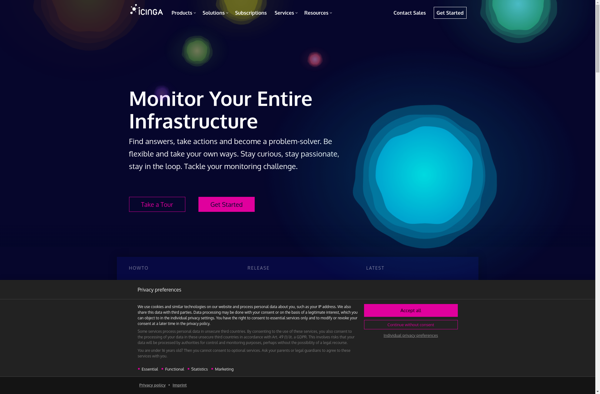
Icinga is an open source monitoring system which checks the availability of your network resources, notifies users of outages, and generates performance data for reporting. It is a fork of the popular Nagios monitoring system and aims to improve upon some of its shortcomings.Some key features of Icinga include:Monitoring of...
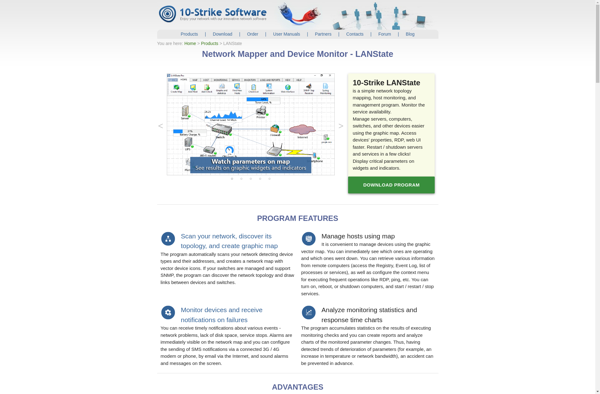
LANState is a network monitoring and management software designed specifically for local area networks (LANs) in businesses and organizations. It provides a centralized way for network administrators to visualize the status, performance, and connections across the LAN in real time.Key features of LANState include:Automatic discovery of devices on the LAN...
Trafikito is a comprehensive digital marketing suite designed to help website owners, marketers, and agencies better understand and improve the traffic to their sites. Some key features of Trafikito include:Website traffic analytics - In-depth reporting on visits, Unique visitors, page views, bounce rates, conversion rates, and more. Integrates with Google...
CloudMonix is a comprehensive cloud management platform designed to provide visibility, governance, and automation across public, private, and hybrid cloud environments. Here are some key capabilities of CloudMonix:Multi-cloud monitoring and management - Discover workloads across AWS, Azure, GCP and Kubernetes and gain unified visibility into resource utilization, performance, cost, security,...
CloudStats is a comprehensive cloud monitoring and analytics platform designed to provide complete visibility into infrastructure and application performance across public, private, and hybrid cloud environments. It is an all-in-one solution for cloud cost management, usage analytics, health monitoring, and log analytics.Key features of CloudStats include:Custom dashboarding to visualize critical...
ElastAlert is an open-source Python rules engine designed for alerting on anomalies, spikes, or other patterns of interest in time series data stored in Elasticsearch. It provides an easy way to create and manage alerts for time series data without writing complex queries or scripts.Some key features of ElastAlert include:Flexible...
AppOptics is a cloud-based application performance monitoring (APM) platform designed for monitoring the performance and availability of cloud applications in real-time. It was acquired by SolarWinds in 2016.AppOptics provides distributed tracing, custom metrics, pre-defined integrations, alerting, and visualization capabilities to gain visibility into application performance across complex, distributed architectures. Key...