CloudMonix
CloudMonix is a cloud management platform that provides visibility and control across multi-cloud environments. It offers features like automated discovery, dependency mapping, cost optimization, security, and compliance.
CloudMonix: Cloud Management Platform
CloudMonix is a cloud management platform that provides visibility and control across multi-cloud environments. It offers features like automated discovery, dependency mapping, cost optimization, security, and compliance.
What is CloudMonix?
CloudMonix is a comprehensive cloud management platform designed to provide visibility, governance, and automation across public, private, and hybrid cloud environments. Here are some key capabilities of CloudMonix:
- Multi-cloud monitoring and management - Discover workloads across AWS, Azure, GCP and Kubernetes and gain unified visibility into resource utilization, performance, cost, security, and compliance.
- Automated dependency mapping - Automatically map out dependencies between cloud resources to understand how they impact each other and the business services they support.
- Cost governance - Get detailed visibility into cloud spending and intelligently optimize costs by right-sizing workloads, eliminating waste, and enforcing budget thresholds.
- Security and compliance - Continuously evaluate cloud resources against industry benchmarks and best practices related to security, access control, encryption and regulatory compliance.
- Automation and self-healing - Use pre-built automations or create custom workflows to provision infrastructure, scale resources, remediate issues, and enforce configurations across cloud environments.
Overall, CloudMonix aims to help enterprise cloud users simplify cloud management, enhance operational agility, reduce costs, strengthen security, and make the most of their multi-cloud investments.
CloudMonix Features
Features
- Multi-cloud management
- Resource tracking
- Cost monitoring
- Automated discovery
- Dependency mapping
- Security and compliance
Pricing
- Freemium
- Subscription-Based
Pros
Single pane of view across cloud environments
Automated resource tracking and mapping
Optimization recommendations to reduce costs
Compliance monitoring and alerting
Cons
Can be complex to set up and configure initially
Limited native support for some niche cloud platforms
Advanced features like auto-remediation require higher pricing tiers
Official Links
Reviews & Ratings
Login to ReviewThe Best CloudMonix Alternatives
View all CloudMonix alternatives with detailed comparison →
Top Ai Tools & Services and Cloud Management and other similar apps like CloudMonix
Here are some alternatives to CloudMonix:
Suggest an alternative ❐Datadog
Datadog is a SaaS-based monitoring and analytics platform for cloud applications. It provides complete visibility into dynamic infrastructures by aggregating metrics, events, and logs from servers, containers, databases, tools, and services. This allows Dev and Ops teams to quickly solve performance problems, prove the root cause of software bugs, spot...

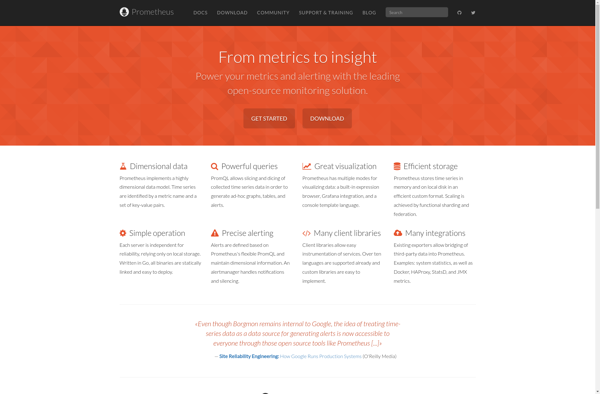
Prometheus
Prometheus is an open source monitoring and alerting system optimized for containerized environments like Kubernetes. It provides real-time visibility into applications, infrastructure, and services running in an environment.Prometheus works by scraping and storing time series data from various systems and services. It collects metrics from targets using either a pull...
Grafana
Grafana is a feature-rich, open source analytics and monitoring visualization suite. It integrates tightly with a variety of database technologies like Graphite, Prometheus, InfluxDB, Elasticsearch, and more to allow for easy exploration and visualization of time series data. Some key capabilities and benefits of Grafana include:Intuitive graphical UI makes it...

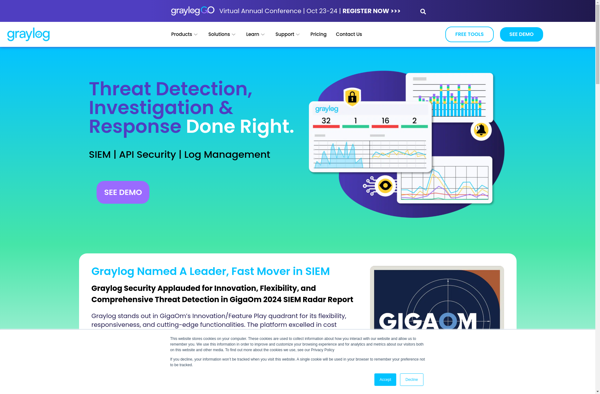
Graylog
Graylog is an open source log management and analysis platform optimized for high volumes of machine-generated data. It collects, indexes, and analyzes log messages, events, and other time-series data from various systems and applications.Some key features and capabilities of Graylog include:Real-time processing and analysis of log data as it is...
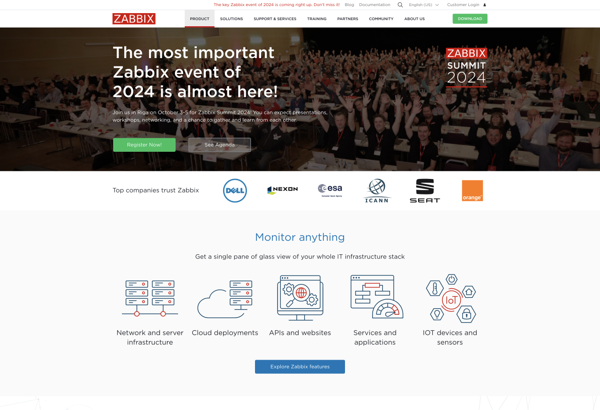
Zabbix
Zabbix is an enterprise-class open source distributed monitoring solution for networks and applications. It is designed to monitor and track the status of various network services, servers, and other network hardware. It provides real-time graphing, alerting, visualization and reporting for monitoring IT infrastructure performance and availability.Some of the key features...
Paessler PRTG Network Monitor
Paessler PRTG Network Monitor is a powerful and comprehensive infrastructure and network monitoring software. It can monitor a wide range of IT infrastructure components and network devices including:Servers (Windows, Linux, UNIX, etc.)Network devices like routers, switches, firewallsVirtualization platforms like VMware and Hyper-VWebsites and web applicationsCloud services like AWS, Azure, and...
Nagios
Nagios is an open source computer system and network monitoring software application. It watches hosts and services, sends notifications when things go wrong, and alerts users when issues come up. Nagios helps system administrators detect and resolve IT infrastructure problems before they affect critical business processes.Some key capabilities of Nagios...

Spiceworks
Spiceworks is a free, ad-supported IT management software suite aimed at small and mid-size businesses. It includes a variety of features to help IT professionals monitor, manage, and troubleshoot their infrastructure and technology stack.Key features of Spiceworks include:Network monitoring and alertsInventory management and reportingIntegrated help desk and ticketing systemClient monitoring...

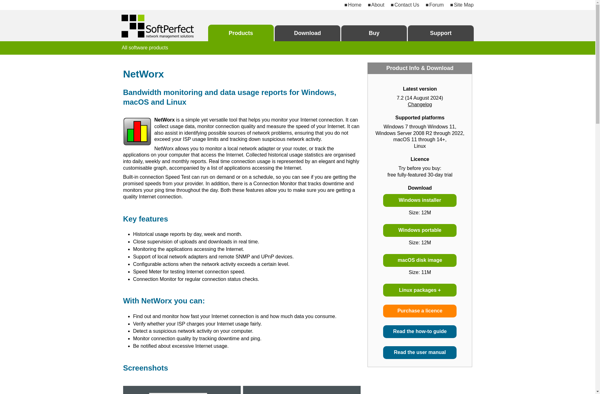
NetWorx
NetWorx is a comprehensive and easy-to-use network monitoring software for Windows. It allows users to analyze all inbound and outbound network traffic and measure internet data usage and speeds.Some key features of NetWorx include:Track total bandwidth usage and log detailed usage statistics per applicationSet bandwidth allowances and alerts for individual...
TrafficMonitor
TrafficMonitor is a user-friendly web analytics platform for monitoring and analyzing website traffic and visitor behavior. It provides website owners, marketers, and analysts with in-depth intelligence to make data-driven decisions.With TrafficMonitor, you can track key metrics like visit volume, visitor geographic location, page views, bounce rates, referral websites, popular site...
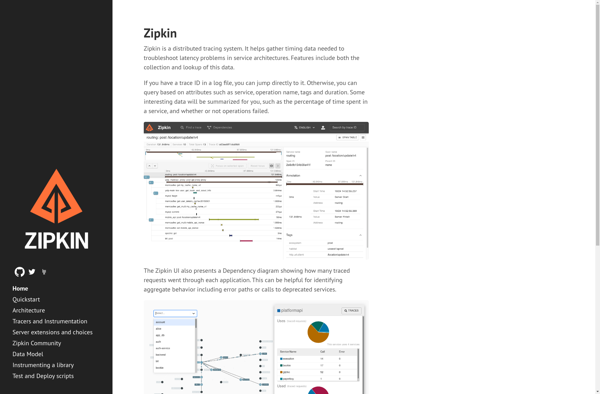
Zipkin
Zipkin is an open source distributed tracing system used for gathering timing data needed to troubleshoot latency problems in microservice architectures. It helps pinpoint where failures or latency issues occur in complex systems with many inter-service calls.Zipkin provides both data collection and visualization. It instruments application code to gather timing...
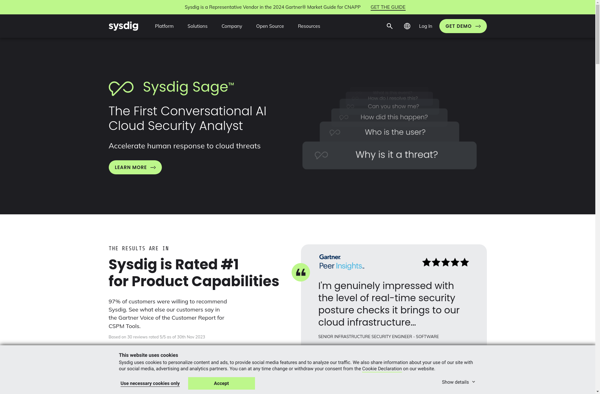
Sysdig
Sysdig is an open source troubleshooting and observability platform designed for containers, Kubernetes, and cloud-native infrastructure. It gives developers, SREs, and infrastructure engineers total visibility into applications, microservices, containers, hosts, networks, and public cloud services to monitor, troubleshoot, and secure complex modern environments.Key capabilities and benefits of Sysdig include:Real-time visibility...
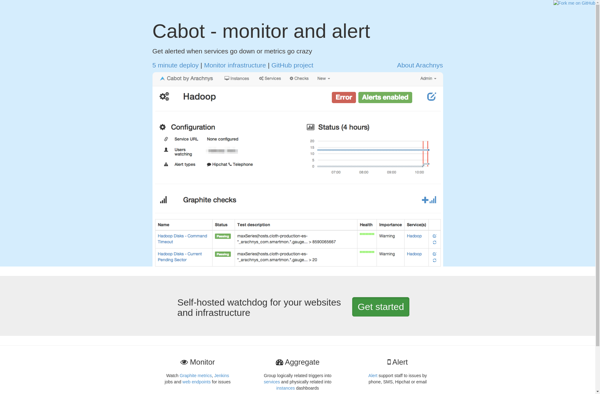
Cabot
Cabot is an open-source infrastructure monitoring and alerting tool designed specifically for modern cloud environments and containers. It allows users to easily configure alerts and notifications for their services and applications, as well as visualize their overall health.Some key features of Cabot include:Flexible alerting rules based on a variety of...
Octopussy
Octopussy is an open source log management and monitoring solution optimized for simplicity. It provides log aggregation from multiple sources, automatic parsing and analysis of log data, as well as visualization through dashboards and reports.Some key capabilities and benefits of Octopussy include:Centralized logging - Collect logs from various systems, servers,...
Corlysis
Corlysis is an open-source, cross-platform alternative to Minitab Statistical Software. It is a desktop application available for Windows, Mac, and Linux operating systems that provides extensive capabilities for statistical analysis and data visualization.With Corlysis, users can import data from a variety of sources including CSV files, databases, and other statistical...
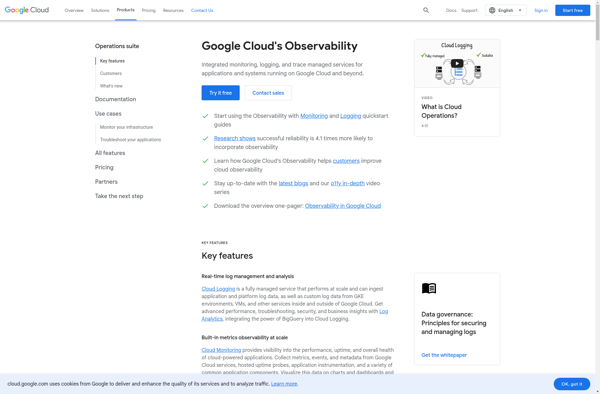
Stackdriver
Stackdriver is a cloud-based monitoring, logging, and diagnostics platform offered by Google Cloud. It provides performance monitoring, uptime checking, dashboards, alerting, log management, and troubleshooting capabilities for cloud services and applications running on Google Cloud Platform, Amazon Web Services, and on-premises environments.Key capabilities and features of Stackdriver include:Monitoring of metrics...
FusionReactor
FusionReactor is a powerful performance monitoring and profiling solution designed specifically for Java applications. It gives developers unprecedented visibility into the real-time performance and behavior of Java web and application servers.Some key features of FusionReactor include:Real-time monitoring of response times, throughput, memory usage, bottlenecks and moreDrill-down diagnostics to pinpoint the...

Hyperic
Hyperic is an open source IT management and monitoring software designed to provide broad visibility and control across physical, virtual and cloud environments. It can automatically discover infrastructure and applications, measure availability and performance, detect problems, correlate events and facilitate rapid troubleshooting.Key features of Hyperic include:Automatic discovery and mapping of...

Tivoli Business Service Manager
Tivoli Business Service Manager (TBSM) is an IT service management software solution from IBM. It helps organizations manage, monitor and optimize their IT services and infrastructure to improve quality of service and availability.Key features and capabilities of Tivoli Business Service Manager include:Discovery and visualization - Automatically discovers IT infrastructure components...
JavOSize
javOSize is an open source Java profiler designed to analyze memory usage and object allocation in Java applications. It provides useful insights for Java developers to understand and optimize their application's memory utilization.Key features of javOSize include:Detailed reporting on memory consumption, including per-class and package breakdownsTracking of object allocation rates...
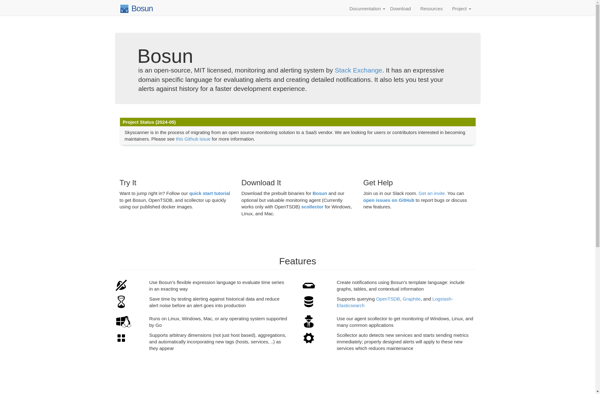
Bosun
Bosun is an open-source monitoring and alerting system created by Stack Exchange. It is designed to monitor, analyze, and alert on time-series data from databases, metrics systems, web servers, and other systems that output numeric data over time.Some key features of Bosun include:Flexible query language (SQRL) to search, filter, aggregate,...