javOSize is an open source Java profiler that analyzes memory usage and objects created in a Java application. It helps developers optimize and reduce memory consumption.
javOSize is an open source Java profiler that analyzes memory usage and objects created in a Java application. It helps developers optimize and reduce memory consumption.
What is JavOSize?
javOSize is an open source Java profiler designed to analyze memory usage and object allocation in Java applications. It provides useful insights for Java developers to understand and optimize their application's memory utilization.
Key features of javOSize include:
Detailed reporting on memory consumption, including per-class and package breakdowns
Tracking of object allocation rates to identify hotspots
Low overhead profiling suitable for production applications
Ability to profile locally or attach to remote JVM instances
Command line, API, and UI interfaces to view reports
By highlighting classes and code paths responsible for high memory use, javOSize enables developers to reduce the application's overall memory footprint through targeted optimizations. Its production-safe characteristics allow profiling to occur on live systems.
If you're looking to understand, analyze and reduce your Java application's memory usage, javOSize is an excellent open source tool to leverage.
JavOSize Features
Features
Memory usage analysis
Object allocation tracking
CPU usage monitoring
Method-level profiling
Graphical user interface
Pricing
Open Source
Pros
Open source and free
Lightweight and low overhead
Easy to integrate into projects
Helpful for optimizing memory usage
Can profile specific methods
Cons
Limited reporting compared to commercial profilers
Setup requires code changes
Only profiles memory and objects, not other performance data
Datadog is a SaaS-based monitoring and analytics platform for cloud applications. It provides complete visibility into dynamic infrastructures by aggregating metrics, events, and logs from servers, containers, databases, tools, and services. This allows Dev and Ops teams to quickly solve performance problems, prove the root cause of software bugs, spot...
New Relic is a comprehensive application performance monitoring and observability platform used by software engineers to monitor, troubleshoot, and optimize their applications and infrastructure. It provides real-time visibility into the performance, health, and usage of applications running in cloud, hybrid, and on-premises environments.Key features of New Relic include:Application monitoring -...
What Is AppDynamics?AppDynamics is an application performance monitoring (APM) and observability platform owned by Cisco. It provides real-time visibility into application performance, user experience, and business impact across complex distributed systems.Key FeaturesAppDynamics automatically discovers and maps application topology — every service, database, API call, and third-party dependency. It traces individual...
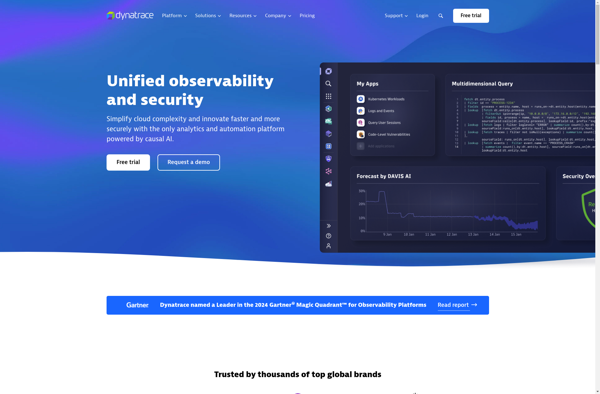
Dynatrace is an AI-powered observability platform designed for monitoring complex, dynamic multi-cloud environments. It automatically discovers and maps full-stack dependencies to provide an end-to-end visualization of the entire ecosystem.Key capabilities and benefits of Dynatrace include:Automatic and intelligent observability - Performs automatic baselining and anomaly detection using deterministic AI to surface...
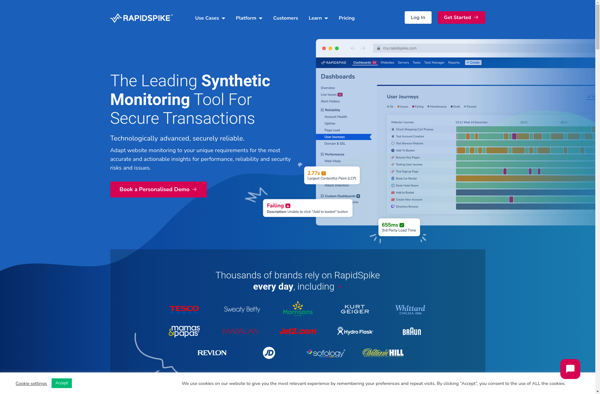
RapidSpike is a powerful yet easy-to-use load and performance testing tool designed for testing the performance of web applications. It provides the ability to simulate hundreds or thousands of concurrent virtual users to generate realistic workloads on web apps to identify performance bottlenecks and ensure applications can handle expected traffic.Key...
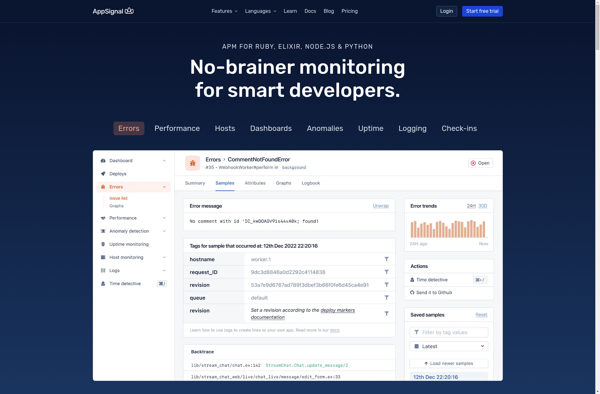
AppSignal is a robust application performance monitoring and error tracking tool designed specifically for Ruby and Elixir applications. It gives detailed insights into the performance of Rails, Sinatra, Padrino and Grape apps to help debug errors and monitor key metrics.Key features include:Performance metrics - AppSignal measures request times, database queries,...
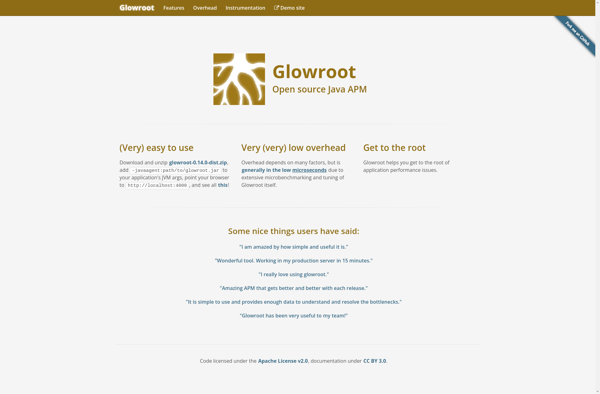
Glowroot is an open source Java Application Performance Monitoring (APM) tool for diagnosing performance issues in Java applications. It is designed specifically for monitoring Java applications in production environments with minimal overhead.Some key features of Glowroot include:Real-time monitoring of response time, throughput, error rates etc.Transaction tracing showing exact timings across...
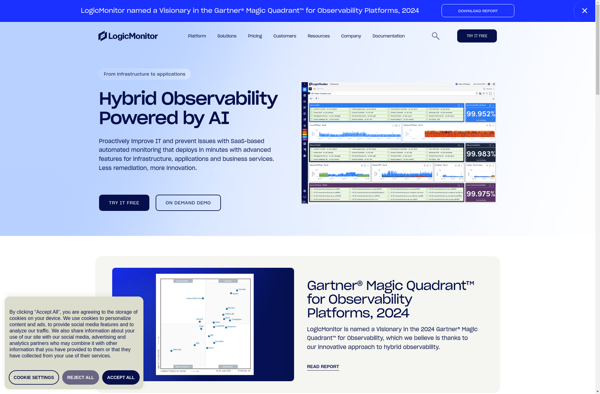
LogicMonitor is an infrastructure monitoring software platform that was founded in 2008. It is designed for modern, dynamic IT environments and provides organizations with visibility of their infrastructure performance and availability including networks, servers, applications and more across cloud, on-prem, hybrid and multi-cloud environments.Some key capabilities and benefits of LogicMonitor...
CloudMonix is a comprehensive cloud management platform designed to provide visibility, governance, and automation across public, private, and hybrid cloud environments. Here are some key capabilities of CloudMonix:Multi-cloud monitoring and management - Discover workloads across AWS, Azure, GCP and Kubernetes and gain unified visibility into resource utilization, performance, cost, security,...
OverOps is a production monitoring and debugging platform optimized for Java and .NET applications. It gives software teams code-level visibility into production failures and exceptions to help quickly identify, triage, and resolve issues.Key features of OverOps include:Real-time error and exception reporting - OverOps captures and analyzes failures as they occur...
IQLECT is an e-learning software used to create interactive online courses and training programs. It provides a suite of tools that enable teachers, professors, corporate trainers and instructional designers to author rich and engaging learning content.Key features of IQLECT include:Intuitive course authoring tools to build interactive lessons, assessments, simulations, scenarios...