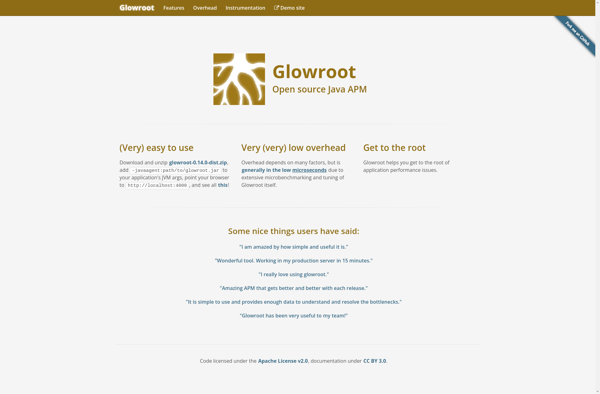
Glowroot is an open source Java Application Performance Monitoring (APM) tool. It is used to monitor, profile and diagnose performance issues in Java applications in real-time. Glowroot is lightweight, easy to use, and provides detailed monitoring data to quickly find and fix per
Glowroot is an open source Java Application Performance Monitoring (APM) tool. It is used to monitor, profile and diagnose performance issues in Java applications in real-time. Glowroot is lightweight, easy to use, and provides detailed monitoring data to quickly find and fix performance bottlenecks.
What is Glowroot?
Glowroot is an open source Java Application Performance Monitoring (APM) tool for diagnosing performance issues in Java applications. It is designed specifically for monitoring Java applications in production environments with minimal overhead.
Some key features of Glowroot include:
Real-time monitoring of response time, throughput, error rates etc.
Transaction tracing showing exact timings across distributed systems
Dynamic collection of additional detail via Aspects
Aggregation of metrics across multiple application instances
Overhead as little as 1% so can be used in production
Simple browser-based user interface for alerts, reports and analysis
Built-in JVM diagnostics capability
Open source with an Apache license
Glowroot works by using bytecode instrumentation to add monitoring probes to the application code without changing any application logic. This allows it to provide very detailed monitoring data with minimal overhead. The centralized collector aggregates and analyzes data across all application instances.
With its ease of use, low overhead, and rich set of features for identifying performance issues - Glowroot forms an invaluable APM tool for monitoring Java applications in dev, test and production environments.
Glowroot Features
Features
Real-time monitoring and profiling of JVM applications
Captures detailed timings for transactions, methods, SQL queries
Aggregates and analyzes performance metrics
Distributed tracing support
Alerting based on performance thresholds
Web-based UI with drilldown capabilities
Pricing
Open Source
Pros
Open source and free
Lightweight and low overhead
Easy to install and configure
Provides detailed performance insights
Can be used in production environments
Cons
Limited to monitoring Java applications only
Not as feature rich as commercial APM tools
Lacks support and training compared to commercial tools
Datadog is a SaaS-based monitoring and analytics platform for cloud applications. It provides complete visibility into dynamic infrastructures by aggregating metrics, events, and logs from servers, containers, databases, tools, and services. This allows Dev and Ops teams to quickly solve performance problems, prove the root cause of software bugs, spot...
New Relic is a comprehensive application performance monitoring and observability platform used by software engineers to monitor, troubleshoot, and optimize their applications and infrastructure. It provides real-time visibility into the performance, health, and usage of applications running in cloud, hybrid, and on-premises environments.Key features of New Relic include:Application monitoring -...
What Is AppDynamics?AppDynamics is an application performance monitoring (APM) and observability platform owned by Cisco. It provides real-time visibility into application performance, user experience, and business impact across complex distributed systems.Key FeaturesAppDynamics automatically discovers and maps application topology — every service, database, API call, and third-party dependency. It traces individual...
Dynatrace is an AI-powered observability platform designed for monitoring complex, dynamic multi-cloud environments. It automatically discovers and maps full-stack dependencies to provide an end-to-end visualization of the entire ecosystem.Key capabilities and benefits of Dynatrace include:Automatic and intelligent observability - Performs automatic baselining and anomaly detection using deterministic AI to surface...
RapidSpike is a powerful yet easy-to-use load and performance testing tool designed for testing the performance of web applications. It provides the ability to simulate hundreds or thousands of concurrent virtual users to generate realistic workloads on web apps to identify performance bottlenecks and ensure applications can handle expected traffic.Key...
Dotcom-Monitor is a robust website and server monitoring service used to track uptime, performance, and functionality of web-based applications and infrastructure. It works by performing automated tests from points around the world to simulate visitor traffic and identify any potential problems or outages.Key features of Dotcom-Monitor include:Uptime monitoring - Regular...
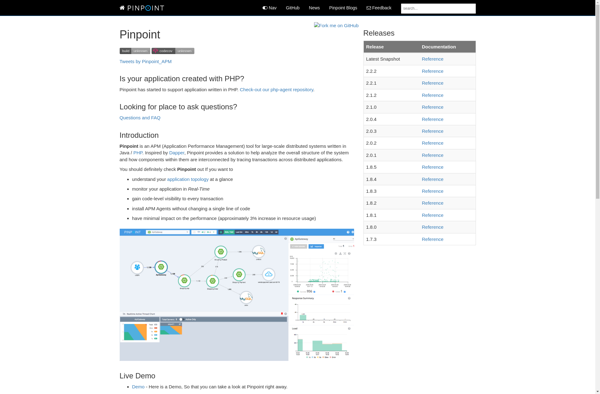
Pinpoint APM from Amazon Web Services is a full-featured application performance monitoring and management service designed for applications deployed on AWS infrastructure. It provides deep visibility into application performance, from the front-end to the database layer, to identify and troubleshoot issues quickly.Key capabilities and benefits of Pinpoint APM include:Distributed tracing...
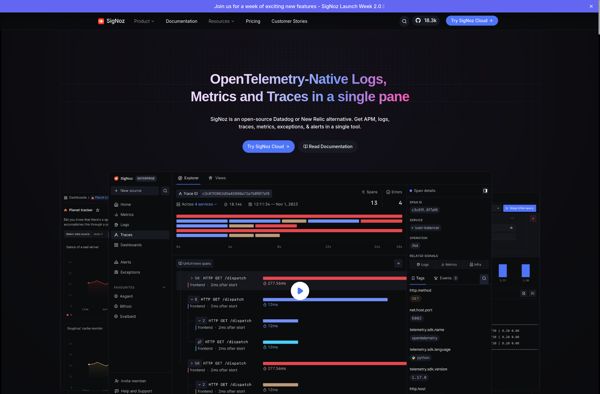
SigNoz is an open-source alternative to commercial Application Performance Monitoring (APM) tools like DataDog, New Relic, and Dynatrace. It is a cloud-native observability platform designed specifically for monitoring modern distributed systems.Some key capabilities and benefits of SigNoz include:Lightweight and optimized for microservices, serverless, and Kubernetes environmentsCollects metrics, traces, and logs...
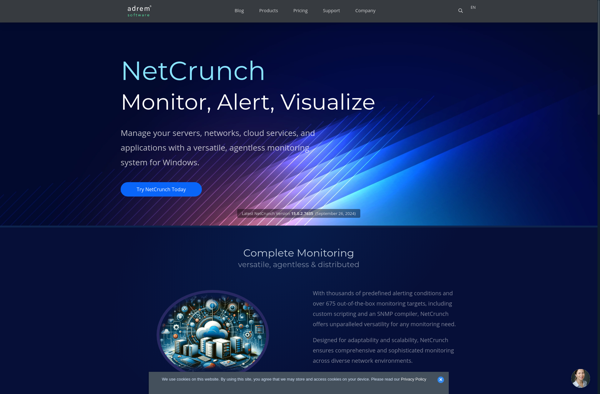
NetCrunch is an all-in-one network monitoring and management system designed for networks of all sizes. It provides real-time monitoring, alerting, reporting, mapping, and analysis of IT infrastructure performance and availability.Key features of NetCrunch include:Auto-discovery of devices on the networkMonitoring of network performance metrics like bandwidth utilization, latency, errors, etc.Monitoring of...
CoScale is a monitoring and analytics platform purpose-built for containers and microservices environments. It provides deep visibility into dynamic container infrastructures to help optimize performance, availability, and efficiency.Key features of CoScale include:Auto-discovery of containers and microservices - CoScale automatically detects all containers and microservices across clusters and cloud environments.Container-native metrics...
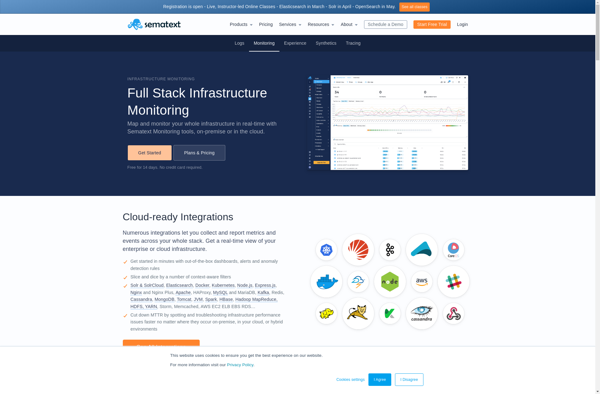
Sematext Infrastructure Monitoring is a comprehensive observability solution designed for modern infrastructure and applications. It allows organizations to gain full visibility and insights into their systems and services across on-prem, hybrid, and multi-cloud environments.Key features include:Metrics monitoring and anomaly detection for infrastructure, containers, services, applicationsLog management with analysis and alerting...
TraceView is a performance profiling tool specifically for Android applications. It allows developers to trace method calls and measure execution times to understand where an app may be spending too much time or encountering bottlenecks.Some key features of TraceView include:Method tracing to see which methods are called and how long...
IQLECT is an e-learning software used to create interactive online courses and training programs. It provides a suite of tools that enable teachers, professors, corporate trainers and instructional designers to author rich and engaging learning content.Key features of IQLECT include:Intuitive course authoring tools to build interactive lessons, assessments, simulations, scenarios...
javOSize is an open source Java profiler designed to analyze memory usage and object allocation in Java applications. It provides useful insights for Java developers to understand and optimize their application's memory utilization.Key features of javOSize include:Detailed reporting on memory consumption, including per-class and package breakdownsTracking of object allocation rates...