Dynatrace
Dynatrace is an AI-powered observability platform for dynamic multi-cloud environments. It provides automatic and intelligent observability to optimize cloud ecosystem performance, provide answers via explainable AI, and accelerate cloud migration and adoption.
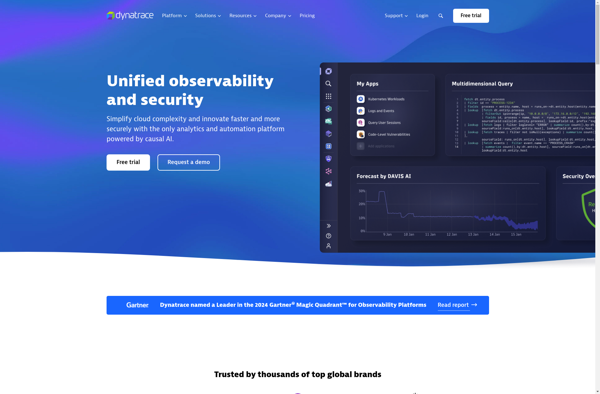
Dynatrace: AI-Powered Observability Platform for Multi-Cloud Environments
Dynatrace provides automatic and intelligent observability to optimize cloud ecosystem performance, provide answers via explainable AI, and accelerate cloud migration and adoption.
What is Dynatrace?
Dynatrace is an AI-powered observability platform designed for monitoring complex, dynamic multi-cloud environments. It automatically discovers and maps full-stack dependencies to provide an end-to-end visualization of the entire ecosystem.
Key capabilities and benefits of Dynatrace include:
- Automatic and intelligent observability - Performs automatic baselining and anomaly detection using deterministic AI to surface problems faster.
- Answers via explainable AI - Provides precise answers to issues, not just more data, including severity assessment, impacted users, and root cause analysis.
- Optimizes cloud ecosystem performance - Continuously optimizes cloud performance and experience via auto-remediation and smartscape management.
- Accelerates cloud migration and adoption - Simplifies cloud migrations through automation and one-click instrumentation.
- Powerful analytics - Ingests and analyzes metrics, logs, and traces at massive scale to enable faster decision-making.
- Enterprise scale - Supports web-scale environments with minimal overhead based on PurePath® distributed tracing technology.
Dynatrace is trusted by 9000+ enterprise customers worldwide, including leaders across financial services, manufacturing, software and internet services.
Dynatrace Features
Features
- AI-powered observability
- Automatic and intelligent observability
- Real user monitoring
- Infrastructure monitoring
- Application performance monitoring
- Digital experience monitoring
- Log monitoring and analytics
- Network monitoring
- Code-level diagnostics
Pricing
- Subscription-Based
Pros
Powerful AIOps capabilities
Flexible licensing options
Intuitive UI with actionable insights
Robust alerting and anomaly detection
Seamless view across entire stack
Easy to deploy and integrate
Cons
Can be complex for smaller environments
Steep learning curve
Requires significant configuration
Higher cost than competitors
Official Links
Reviews & Ratings
Login to ReviewThe Best Dynatrace Alternatives
View all Dynatrace alternatives with detailed comparison →
Top Ai Tools & Services and Application Performance Monitoring and other similar apps like Dynatrace
Here are some alternatives to Dynatrace:
Suggest an alternative ❐Datadog
Datadog is a SaaS-based monitoring and analytics platform for cloud applications. It provides complete visibility into dynamic infrastructures by aggregating metrics, events, and logs from servers, containers, databases, tools, and services. This allows Dev and Ops teams to quickly solve performance problems, prove the root cause of software bugs, spot...

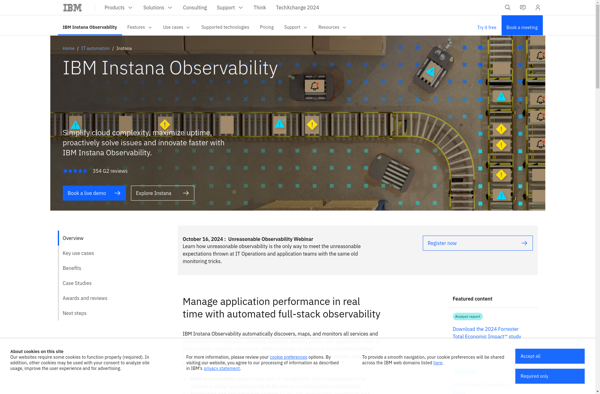
Instana
Instana is an application performance monitoring and observability platform designed specifically for modern cloud-native applications. It provides automatic end-to-end tracing, metrics, and logs collection for microservices and containerized applications running on Kubernetes, Docker, AWS, Azure and Google Cloud.Key capabilities and benefits of Instana include:Automated discovery of microservices and infrastructureDistributed tracing...
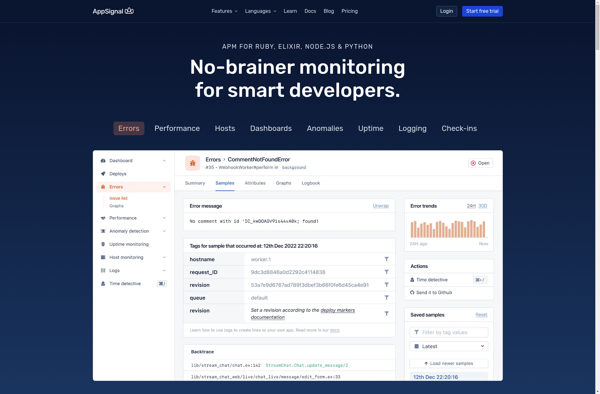
AppSignal
AppSignal is a robust application performance monitoring and error tracking tool designed specifically for Ruby and Elixir applications. It gives detailed insights into the performance of Rails, Sinatra, Padrino and Grape apps to help debug errors and monitor key metrics.Key features include:Performance metrics - AppSignal measures request times, database queries,...
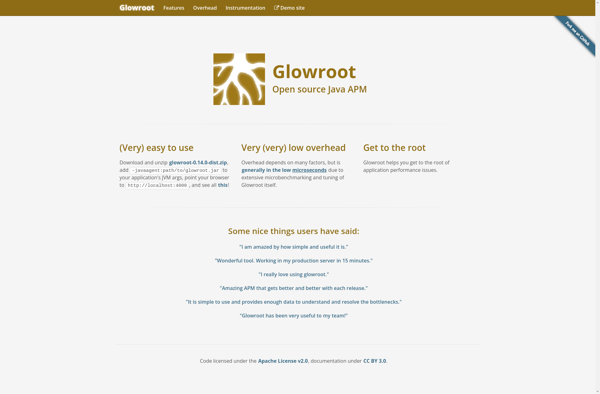
Glowroot
Glowroot is an open source Java Application Performance Monitoring (APM) tool for diagnosing performance issues in Java applications. It is designed specifically for monitoring Java applications in production environments with minimal overhead.Some key features of Glowroot include:Real-time monitoring of response time, throughput, error rates etc.Transaction tracing showing exact timings across...
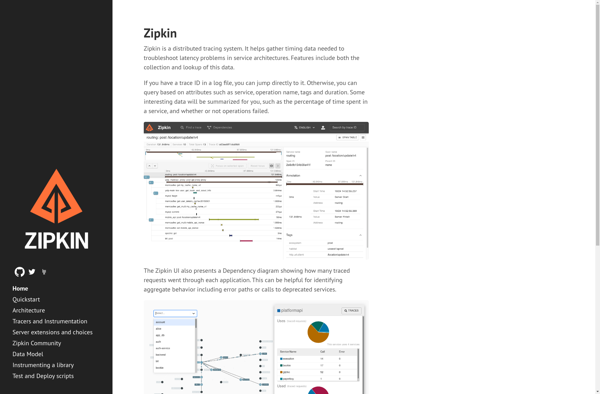
Zipkin
Zipkin is an open source distributed tracing system used for gathering timing data needed to troubleshoot latency problems in microservice architectures. It helps pinpoint where failures or latency issues occur in complex systems with many inter-service calls.Zipkin provides both data collection and visualization. It instruments application code to gather timing...
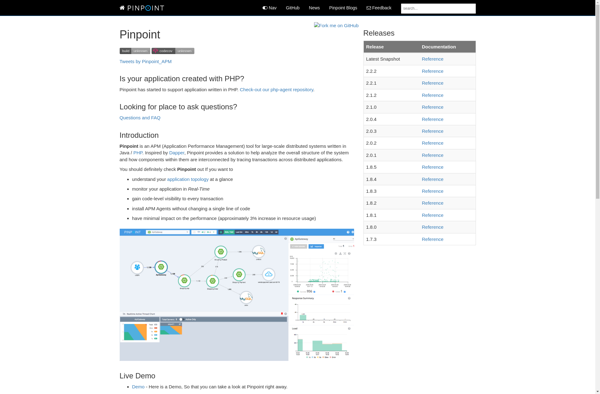
Pinpoint APM
Pinpoint APM from Amazon Web Services is a full-featured application performance monitoring and management service designed for applications deployed on AWS infrastructure. It provides deep visibility into application performance, from the front-end to the database layer, to identify and troubleshoot issues quickly.Key capabilities and benefits of Pinpoint APM include:Distributed tracing...
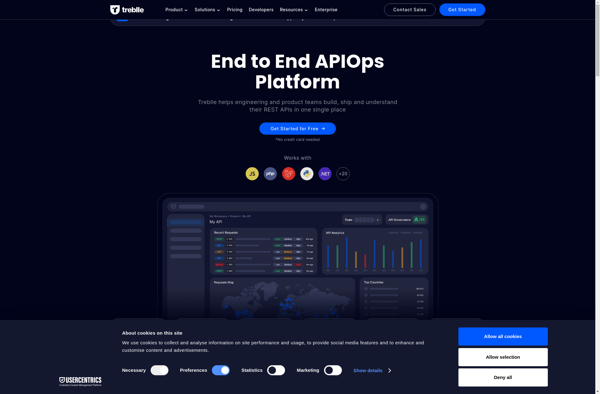
Treblle
Treblle is an API analytics and debugging platform designed specifically for developers and engineering teams. It allows you to easily monitor, troubleshoot, and optimize your APIs.Some key features and benefits of Treblle:Automatic API monitoring - Treblle automatically detects and starts monitoring your API traffic out of the box without complex...
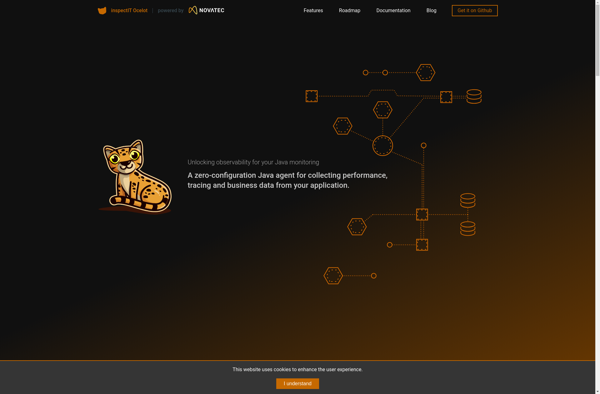
InspectIT
inspectIT is an open-source Java application performance management (APM) tool for monitoring, tracing, analyzing and profiling Java applications in real-time. It works by instrumenting the application's bytecode to collect various performance metrics and trace data without requiring access to the source code.Some key capabilities and benefits of inspectIT include:Near real-time...
SeaLion
SeaLion is an open-source, cross-platform text editor and integrated development environment (IDE). It runs on Windows, macOS, and Linux operating systems.With support for hundreds of programming and markup languages, SeaLion provides developers with syntax highlighting, autocompletion, code linting, debugging tools, version control integration, and many other features to enhance productivity.Some...
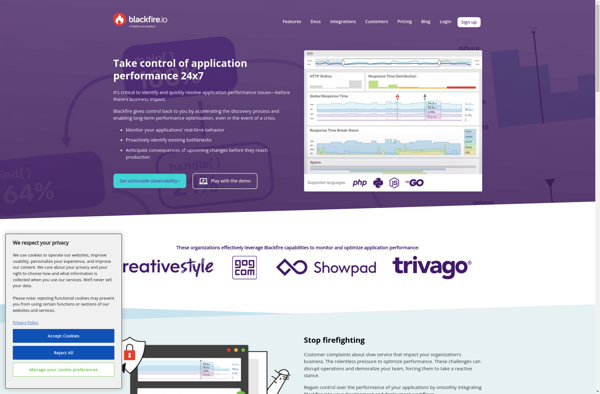
Blackfire.io
Blackfire.io is a comprehensive web profiling solution and PHP debugger for inspecting application performance and code efficiency. It captures detailed timing metrics and execution context on server requests to identify performance issues and optimize web apps.Key features of Blackfire.io include:Identifying slow code paths and bottlenecksMonitoring impact of code changes on...
FusionReactor
FusionReactor is a powerful performance monitoring and profiling solution designed specifically for Java applications. It gives developers unprecedented visibility into the real-time performance and behavior of Java web and application servers.Some key features of FusionReactor include:Real-time monitoring of response times, throughput, memory usage, bottlenecks and moreDrill-down diagnostics to pinpoint the...

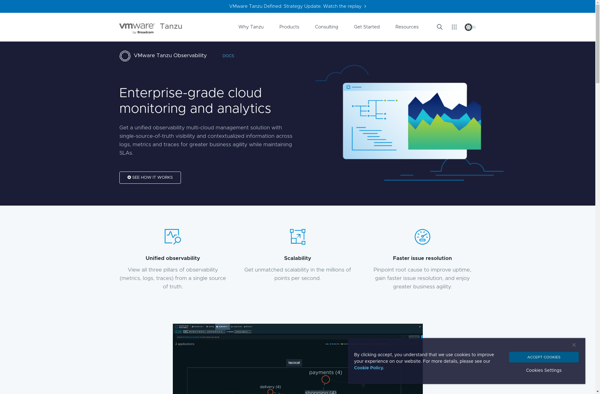
Wavefront by VMware
Wavefront by VMware is a scalable, high-performance metrics monitoring and analytics platform delivered through an end-to-end SaaS solution. It provides real-time granular visibility across complex, modern cloud environments.Key capabilities and benefits of Wavefront include:Ability to collect and analyze metrics and events data from various sources like containers, microservices, cloud platforms...
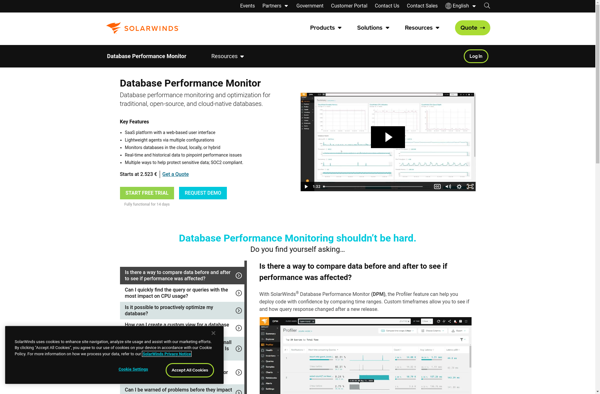
VividCortex
VividCortex is a comprehensive database monitoring and analytics platform designed specifically for MySQL, PostgreSQL, MongoDB, Redis, and other popular databases. It provides unparalleled visibility into your database workload, queries, performance issues, and trends.Key features of VividCortex include:Real-time monitoring of all database queries, with full query details and execution statisticsVisual explain...
CoScale
CoScale is a monitoring and analytics platform purpose-built for containers and microservices environments. It provides deep visibility into dynamic container infrastructures to help optimize performance, availability, and efficiency.Key features of CoScale include:Auto-discovery of containers and microservices - CoScale automatically detects all containers and microservices across clusters and cloud environments.Container-native metrics...
2 Steps
2 Steps is a basic video editing software aimed at beginner or amateur video editors who need to perform simple edits on their footage. It comes with a clean and intuitive interface that allows users to import media, trim clips, stitch together multiple shots, and add common enhancements without needing...
Trace by RisingStack
Trace by RisingStack is an open-source application monitoring and debugging platform designed specifically for Node.js applications. It allows developers to gain deep visibility into their Node.js apps to identify and resolve performance issues and errors.Key features of Trace include:Performance metrics - Trace captures critical metrics like response times, memory usage,...
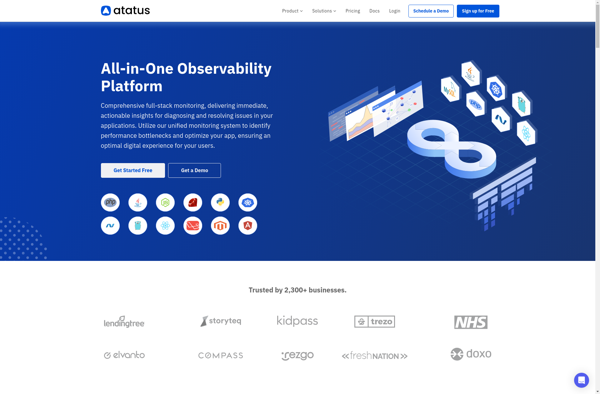
Atatus
Atatus is a comprehensive application performance monitoring and error tracking software designed for web and mobile applications. It provides real-time monitoring of key application performance metrics like response time, throughput, API errors etc. to help developers identify and fix performance issues rapidly.Key features of Atatus include:Error and exception tracking -...
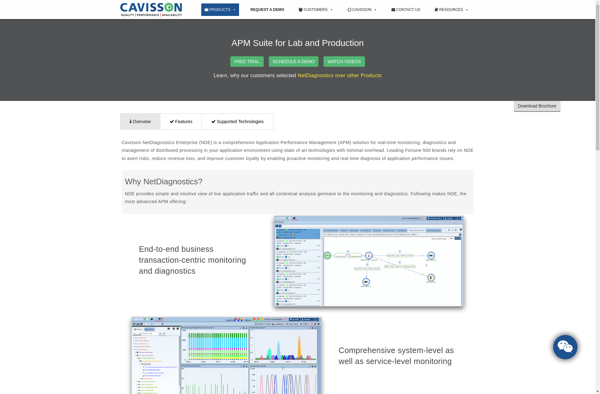
Cavisson NetDiagnostics
Cavisson NetDiagnostics is a comprehensive network performance monitoring and diagnostics software designed to provide real-time visibility into critical business services, transactions, applications and infrastructure. The software helps IT teams to proactively detect, diagnose and resolve issues before they impact users and customers.Key features and capabilities include:Automatic discovery and mapping of...
SynTraffic
SynTraffic is an open-source, cross-platform traffic generation and network simulation application. It provides a graphical user interface and command-line interface to configure and generate various types of traffic profiles and network conditions for testing purposes.Some of the key features of SynTraffic include:Ability to simulate traffic such as HTTP, HTTPS, FTP,...

JavOSize
javOSize is an open source Java profiler designed to analyze memory usage and object allocation in Java applications. It provides useful insights for Java developers to understand and optimize their application's memory utilization.Key features of javOSize include:Detailed reporting on memory consumption, including per-class and package breakdownsTracking of object allocation rates...
SpectrumApp
SpectrumApp is a versatile digital painting and drawing software application designed for Windows and macOS platforms. It offers an intuitive and customizable workspace for artists and graphics designers of all skill levels.Key features of SpectrumApp include:Over 1000 realistic and naturalistic brushes spanning a variety of digital media types like oils,...

LiveMon
LiveMon is an open-source network monitoring and management software. It allows administrators to monitor the health and performance of computer networks and servers in real-time. Key features of LiveMon include:Real-time metrics on network bandwidth utilization, latency, uptime and moreAutomatic detection of network outages and performance degradationVisual mapping of network topology...