Zipkin vs Dynatrace

Struggling to choose between Zipkin and Dynatrace? Both products offer unique advantages, making it a tough decision.

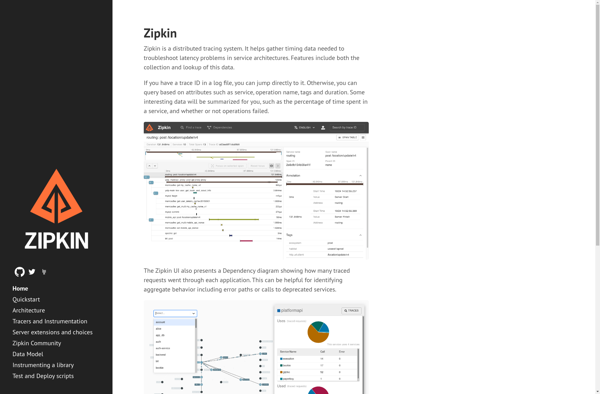
Zipkin is a Development solution with tags like tracing, latency, microservices, visualization.

It boasts features such as Distributed tracing system, Gathers timing data to troubleshoot latency problems, Visualizes timing data between services, Open source and pros including Free and open source, Helps debug microservice architectures, Integrates with many frameworks/languages, Large user community and support.

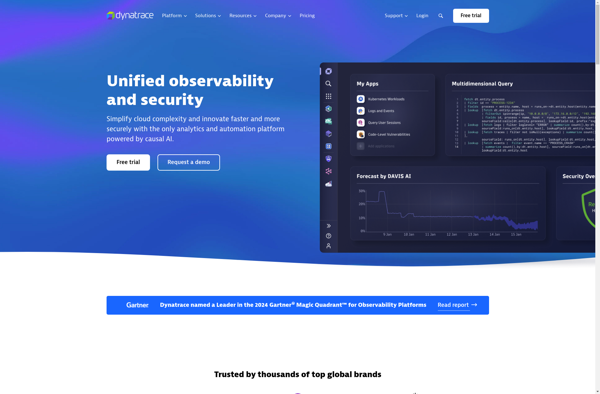
On the other hand, Dynatrace is a Ai Tools & Services product tagged with observability, monitoring, performance, cloud.

Its standout features include AI-powered observability, Automatic and intelligent observability, Real user monitoring, Infrastructure monitoring, Application performance monitoring, Digital experience monitoring, Log monitoring and analytics, Network monitoring, Code-level diagnostics, and it shines with pros like Powerful AIOps capabilities, Flexible licensing options, Intuitive UI with actionable insights, Robust alerting and anomaly detection, Seamless view across entire stack, Easy to deploy and integrate.

To help you make an informed decision, we've compiled a comprehensive comparison of these two products, delving into their features, pros, cons, pricing, and more. Get ready to explore the nuances that set them apart and determine which one is the perfect fit for your requirements.

Zipkin

Zipkin

Zipkin is an open source distributed tracing system. It is used to gather timing data needed to troubleshoot latency problems in microservice architectures. Zipkin helps gather timing data related to inter-service calls and provides tools to visualize this data.

Categories:
tracing latency microservices visualization

Zipkin Features

  1. Distributed tracing system
  2. Gathers timing data to troubleshoot latency problems
  3. Visualizes timing data between services
  4. Open source

Pricing

  • Open Source

Pros

Free and open source

Helps debug microservice architectures

Integrates with many frameworks/languages

Large user community and support

Cons

Complex setup and configuration

Steep learning curve

Additional overhead on services

Only focuses on tracing, not other observability data


Dynatrace

Dynatrace

Dynatrace is an AI-powered observability platform for dynamic multi-cloud environments. It provides automatic and intelligent observability to optimize cloud ecosystem performance, provide answers via explainable AI, and accelerate cloud migration and adoption.

Categories:
observability monitoring performance cloud

Dynatrace Features

  1. AI-powered observability
  2. Automatic and intelligent observability
  3. Real user monitoring
  4. Infrastructure monitoring
  5. Application performance monitoring
  6. Digital experience monitoring
  7. Log monitoring and analytics
  8. Network monitoring
  9. Code-level diagnostics

Pricing

  • Subscription-Based

Pros

Powerful AIOps capabilities

Flexible licensing options

Intuitive UI with actionable insights

Robust alerting and anomaly detection

Seamless view across entire stack

Easy to deploy and integrate

Cons

Can be complex for smaller environments

Steep learning curve

Requires significant configuration

Higher cost than competitors