CoScale is a monitoring and analytics platform designed specifically for containers and microservices. It provides visibility into containerized environments and microservices architectures to help optimize performance and availability.
CoScale: Container Monitoring and Analytics Platform
Monitoring and analytics platform for containers and microservices, providing visibility into containerized environments and microservices architectures for optimal performance and availability.
What is CoScale?
CoScale is a monitoring and analytics platform purpose-built for containers and microservices environments. It provides deep visibility into dynamic container infrastructures to help optimize performance, availability, and efficiency.
Key features of CoScale include:
Auto-discovery of containers and microservices - CoScale automatically detects all containers and microservices across clusters and cloud environments.
Container-native metrics - In addition to traditional system and application metrics, CoScale collects specialized container metrics related to CPU/memory utilization, network I/O, disk usage, and more.
Visual mapping of microservices - See all dependencies and connections between microservices in visual service maps.
Anomaly detection - CoScale uses machine learning to detect anomalies and alert on performance degradation.
Log management - Collect, store, search and analyze logs from containers and orchestrators.
Collaboration features - Share dashboards, metrics, events, etc. across teams.
CoScale integrates with all major container platforms including Kubernetes, Docker, Docker Swarm, Mesosphere DC/OS. It provides a centralized platform for monitoring container and microservices environments across on-premise data centers and public cloud providers.
Datadog is a SaaS-based monitoring and analytics platform for cloud applications. It provides complete visibility into dynamic infrastructures by aggregating metrics, events, and logs from servers, containers, databases, tools, and services. This allows Dev and Ops teams to quickly solve performance problems, prove the root cause of software bugs, spot...
New Relic is a comprehensive application performance monitoring and observability platform used by software engineers to monitor, troubleshoot, and optimize their applications and infrastructure. It provides real-time visibility into the performance, health, and usage of applications running in cloud, hybrid, and on-premises environments.Key features of New Relic include:Application monitoring -...
What Is AppDynamics?AppDynamics is an application performance monitoring (APM) and observability platform owned by Cisco. It provides real-time visibility into application performance, user experience, and business impact across complex distributed systems.Key FeaturesAppDynamics automatically discovers and maps application topology — every service, database, API call, and third-party dependency. It traces individual...
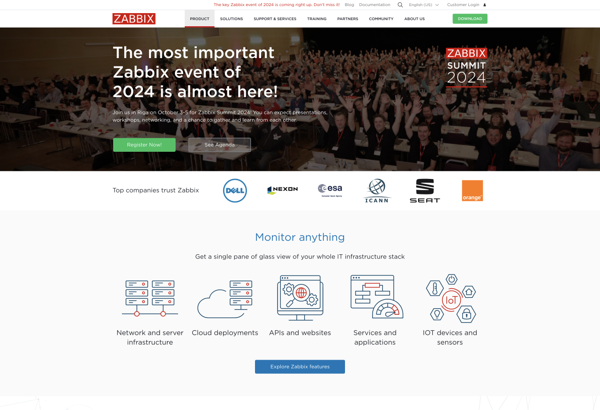
Zabbix is an enterprise-class open source distributed monitoring solution for networks and applications. It is designed to monitor and track the status of various network services, servers, and other network hardware. It provides real-time graphing, alerting, visualization and reporting for monitoring IT infrastructure performance and availability.Some of the key features...
Nagios is an open source computer system and network monitoring software application. It watches hosts and services, sends notifications when things go wrong, and alerts users when issues come up. Nagios helps system administrators detect and resolve IT infrastructure problems before they affect critical business processes.Some key capabilities of Nagios...
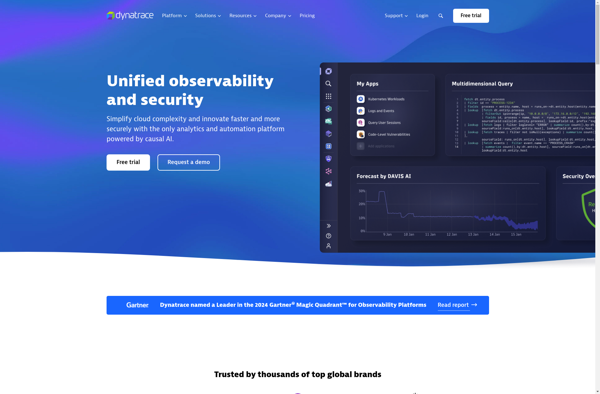
Dynatrace is an AI-powered observability platform designed for monitoring complex, dynamic multi-cloud environments. It automatically discovers and maps full-stack dependencies to provide an end-to-end visualization of the entire ecosystem.Key capabilities and benefits of Dynatrace include:Automatic and intelligent observability - Performs automatic baselining and anomaly detection using deterministic AI to surface...
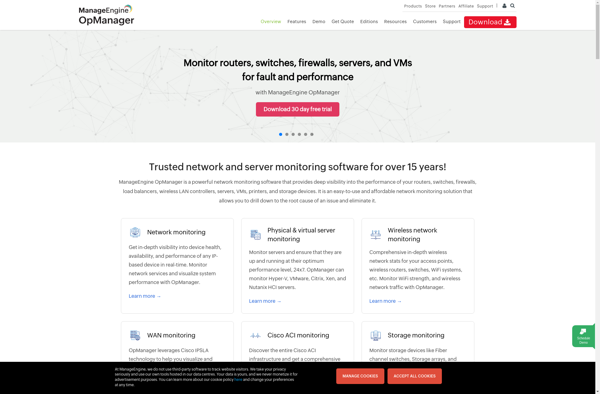
ManageEngine OpManager is a comprehensive IT infrastructure and network monitoring software designed for enterprises. It provides centralized monitoring of on-premise, cloud and hybrid environments including networks, servers, virtualization platforms, applications, logs, and databases from a unified console.Key features of OpManager include:Network mapping and discovery of devices, monitoring network availability and...
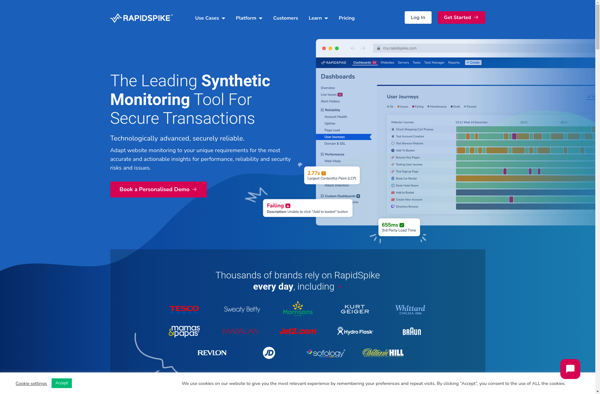
RapidSpike is a powerful yet easy-to-use load and performance testing tool designed for testing the performance of web applications. It provides the ability to simulate hundreds or thousands of concurrent virtual users to generate realistic workloads on web apps to identify performance bottlenecks and ensure applications can handle expected traffic.Key...
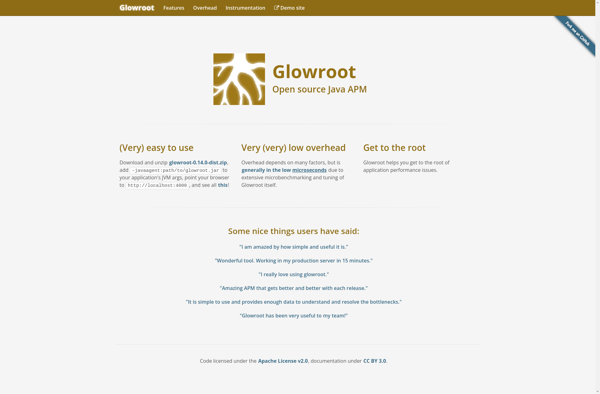
Glowroot is an open source Java Application Performance Monitoring (APM) tool for diagnosing performance issues in Java applications. It is designed specifically for monitoring Java applications in production environments with minimal overhead.Some key features of Glowroot include:Real-time monitoring of response time, throughput, error rates etc.Transaction tracing showing exact timings across...
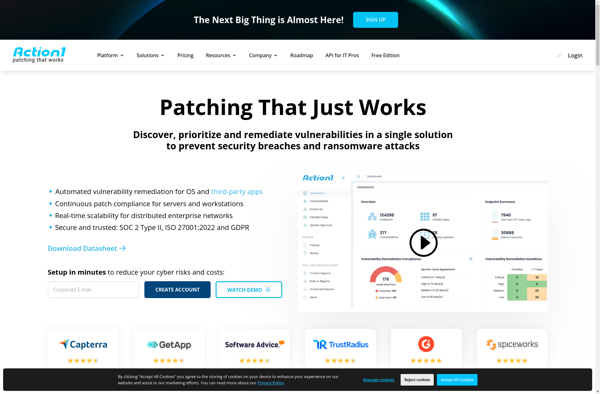
Action1 is a powerful yet easy-to-use workflow automation software. With its intuitive drag-and-drop interface, anyone can automate repetitive workflows and tasks without coding. Action1 connects various apps and services together like LEGO pieces and lets you automate between them.Some key features of Action1 include:Visually build workflows with a simple drag-and-drop...
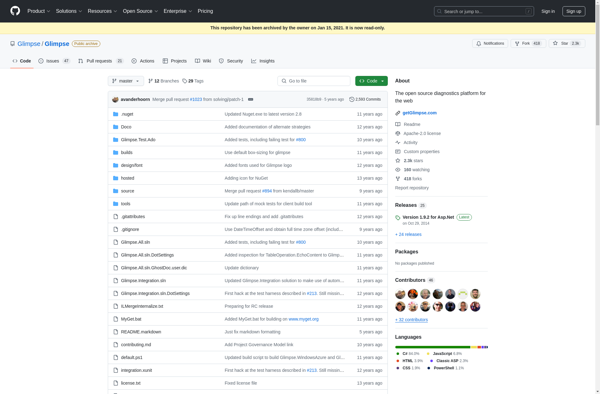
Glimpse is a free, open source raster graphics editor intended as a free software alternative to proprietary software like Adobe Photoshop. It features a number of advanced image manipulation tools that allow users to touch up, edit, transform and modify photographs and images.Some of the key features offered by Glimpse...
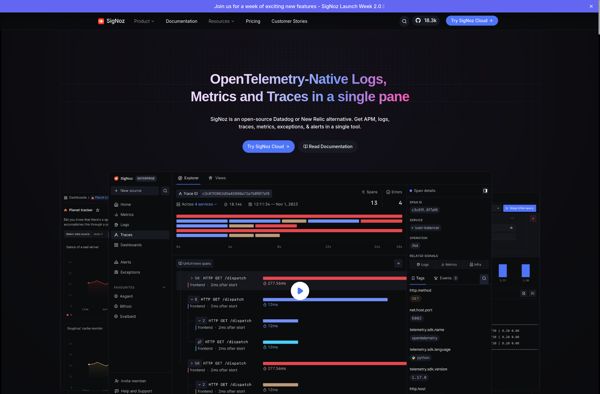
SigNoz is an open-source alternative to commercial Application Performance Monitoring (APM) tools like DataDog, New Relic, and Dynatrace. It is a cloud-native observability platform designed specifically for monitoring modern distributed systems.Some key capabilities and benefits of SigNoz include:Lightweight and optimized for microservices, serverless, and Kubernetes environmentsCollects metrics, traces, and logs...
Wavefront by VMware is a scalable, high-performance metrics monitoring and analytics platform delivered through an end-to-end SaaS solution. It provides real-time granular visibility across complex, modern cloud environments.Key capabilities and benefits of Wavefront include:Ability to collect and analyze metrics and events data from various sources like containers, microservices, cloud platforms...