New Relic

New Relic

New Relic is a performance monitoring software for applications. It allows developers to track and monitor application performance in real-time to detect and diagnose issues. New Relic provides insights into app load times, throughput, errors, and more.
New Relic image
monitoring performance analytics application devops

New Relic: Real-Time Application Performance Monitoring

Real-time performance monitoring for applications, detecting issues and providing insights into app load times, throughput, errors and more.

What is New Relic?

New Relic is a comprehensive application performance monitoring and observability platform used by software engineers to monitor, troubleshoot, and optimize their applications and infrastructure. It provides real-time visibility into the performance, health, and usage of applications running in cloud, hybrid, and on-premises environments.

Key features of New Relic include:

  • Application monitoring - Monitor response time, throughput, errors, Apdex score, host metrics, and more for web and mobile applications. Integrates with popular frameworks like .NET, Java, Ruby, Node.js, etc.
  • Infrastructure monitoring - Monitor the health and utilization of servers, containers, hosts, functions, and other infrastructure.
  • Browser monitoring - Monitor browser-side performance including page load times, AJAX requests, front-end errors, etc.
  • Synthetics monitoring - Simulate user transactions from global locations to monitor availability and performance.
  • Alerting - Get notified when specific events occur like application errors spiking or server memory utilization exceeding a threshold.
  • Logging and error analytics - Aggregate and analyze logs and errors to debug issues faster.
  • API performance monitoring - Monitor the performance of APIs and microservices.
  • Cross-stack traces - Correlate performance data across distributed architectures to identify root cause of issues.
  • Dashboards and visualizations - Customizable dashboards for visualizing metric data.
  • New Relic One - Unified UI and platform for monitoring all your apps, infrastructure, browsers, and synthetic monitors.

With its comprehensive monitoring capabilities and ability to integrate with virtually any system, New Relic provides developers and technical teams unparalleled visibility into the health and performance of both modern and legacy systems.

New Relic Features

Features

  1. Real-time performance monitoring
  2. Error and exception tracking
  3. Transaction tracing
  4. Cross-application tracing
  5. Alerting and notifications
  6. Custom dashboards
  7. Log management
  8. Browser monitoring
  9. Mobile monitoring

Pricing

  • Free
  • Subscription-Based

Pros

Detailed performance insights

Quick and easy setup

Flexible alerting

Integration with many platforms

Good customer support

Cons

Can get expensive for large apps

Steep learning curve

May need additional services for full APM

Alerts can be noisy if not tuned


The Best New Relic Alternatives

Top Ai Tools & Services and Application Performance Monitoring and other similar apps like New Relic


Datadog icon

Datadog

Datadog is a SaaS-based monitoring and analytics platform for cloud applications. It provides complete visibility into dynamic infrastructures by aggregating metrics, events, and logs from servers, containers, databases, tools, and services. This allows Dev and Ops teams to quickly solve performance problems, prove the root cause of software bugs, spot...
Datadog image
AppDynamics icon

AppDynamics

AppDynamics is an application performance management and IT operations analytics platform that helps monitor, troubleshoot and optimize complex applications and IT environments. Some key capabilities and benefits of AppDynamics include: Deep visibility into application performance, user experience and business transactions - AppDynamics traces every transaction end-to-end to provide code-level diagnostics...
AppDynamics image
Prometheus icon

Prometheus

Prometheus is an open source monitoring and alerting system optimized for containerized environments like Kubernetes. It provides real-time visibility into applications, infrastructure, and services running in an environment.Prometheus works by scraping and storing time series data from various systems and services. It collects metrics from targets using either a pull...
Prometheus image
Rollbar icon

Rollbar

Rollbar is a bug and crash reporting software that provides real-time visibility into errors and exceptions in web and mobile applications. Developers integrate Rollbar's SDKs into their code to automatically capture uncaught errors and exceptions. As errors occur, Rollbar groups them together by root cause for easier triaging.Key features of...
Rollbar image
Logz.io icon

Logz.io

logz.io is a cloud-native log management and analytics platform designed for modern cloud-based architectures. It offers the following key capabilities:Real-time log analysis - logz.io ingests and indexes log data from any source in real-time, allowing you to search and analyze log data on-the-fly.Intelligent alerting - Configure advanced correlation rules to...
Logz.io image
Sentry icon

Sentry

Sentry is an open-source error monitoring system that helps developers monitor and fix crashes in real time. It provides full stacktraces and context on bugs or errors in web apps, mobile apps, games, and APIs.Some key features of Sentry include:Real-time error alerts - Sentry sends you alerts as soon as...
Sentry image
Loggly icon

Loggly

Loggly is a scalable log management and analytics platform designed for modern cloud-based applications and infrastructure. It allows developers, DevOps engineers, and IT operations teams to easily aggregate log data from servers, networks, applications, containers, and cloud services into a centralized cloud repository.Key capabilities and benefits of Loggly include:Real-time log...
Loggly image
Honeybadger icon

Honeybadger

Honeybadger is a developer tool that helps Ruby and Python developers monitor their applications for errors and downtime. It gives developers visibility into application issues in real-time by sending alerts whenever errors occur or when the app goes down.Some key features of Honeybadger include:Exception and error monitoring - Get notified...
Honeybadger image
RecTester icon

RecTester

RecTester is an open-source load and performance testing tool designed specifically for testing web applications. It provides an intuitive graphical user interface that allows users to easily record browsing sessions and then replay those sessions to simulate load.Some key features of RecTester include:Record single or multi-page browser sessions via a...
RecTester image
Instana icon

Instana

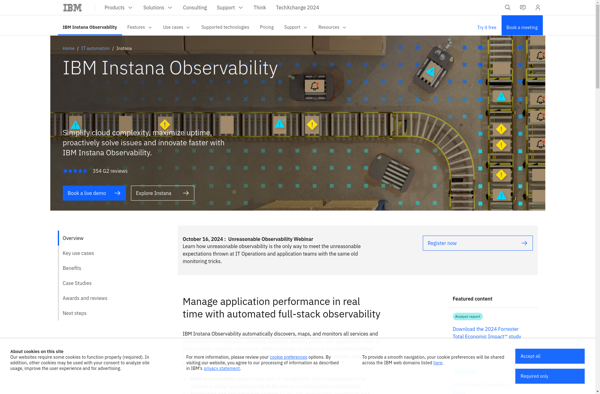
Instana is an application performance monitoring and observability platform designed specifically for modern cloud-native applications. It provides automatic end-to-end tracing, metrics, and logs collection for microservices and containerized applications running on Kubernetes, Docker, AWS, Azure and Google Cloud.Key capabilities and benefits of Instana include:Automated discovery of microservices and infrastructureDistributed tracing...
Instana image
AppSignal icon

AppSignal

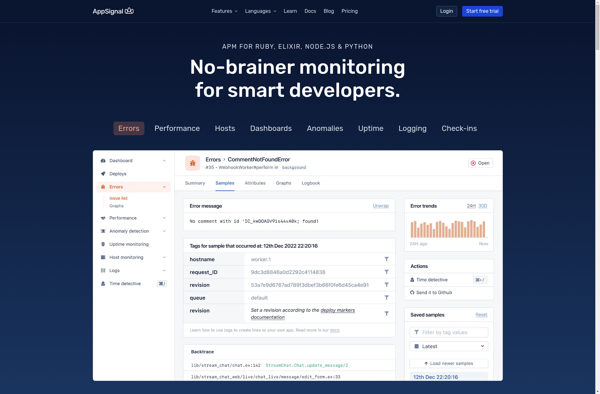
AppSignal is a robust application performance monitoring and error tracking tool designed specifically for Ruby and Elixir applications. It gives detailed insights into the performance of Rails, Sinatra, Padrino and Grape apps to help debug errors and monitor key metrics.Key features include:Performance metrics - AppSignal measures request times, database queries,...
AppSignal image
Better Stack Logs icon

Better Stack Logs

Better Stack Logs is a robust logging and monitoring platform designed for software developers and IT operations teams. It aggregates application and system logs from multiple sources across an infrastructure into a unified dashboard with powerful search and filtering capabilities.Key features include:Collect logs from virtually any source - applications, databases,...
Better Stack Logs image
Glowroot icon

Glowroot

Glowroot is an open source Java Application Performance Monitoring (APM) tool for diagnosing performance issues in Java applications. It is designed specifically for monitoring Java applications in production environments with minimal overhead.Some key features of Glowroot include:Real-time monitoring of response time, throughput, error rates etc.Transaction tracing showing exact timings across...
Glowroot image
Zipkin icon

Zipkin

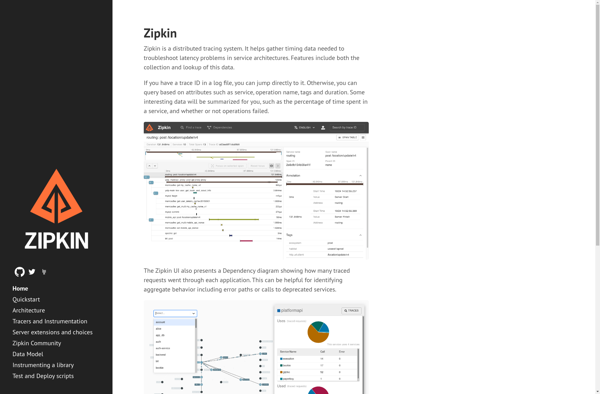
Zipkin is an open source distributed tracing system used for gathering timing data needed to troubleshoot latency problems in microservice architectures. It helps pinpoint where failures or latency issues occur in complex systems with many inter-service calls.Zipkin provides both data collection and visualization. It instruments application code to gather timing...
Zipkin image
SenseLogs icon

SenseLogs

SenseLogs is a user research and feedback platform designed to help product teams better understand user needs and pain points. The software provides an end-to-end solution for planning, conducting, and analyzing qualitative user research.Key features of SenseLogs include:Recruiting - Integrates with panel providers to recruit target users that match your...
SenseLogs image
Jaeger icon

Jaeger

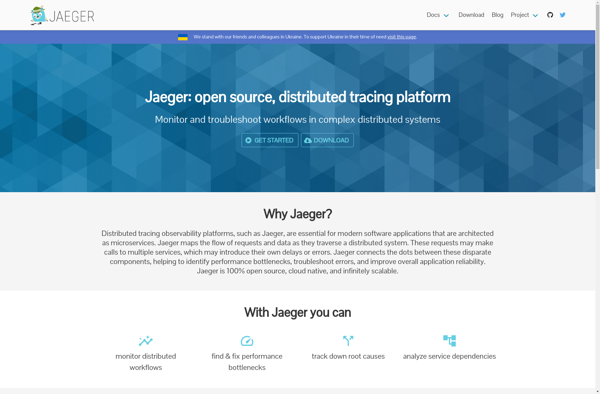
Jaeger is an open source, end-to-end distributed tracing system used for monitoring and troubleshooting microservices-based distributed systems. It provides insight into transaction latency, errors, and dependencies across microservices architectures.Key features of Jaeger include:Distributed context propagation - Jaeger instruments microservices to propagate context/tracing data across process boundariesDistributed transaction monitoring - Jaeger...
Jaeger image
Mist.io icon

Mist.io

Mist.io is an open source cloud management platform that aims to simplify cloud operations across public, private, and hybrid cloud environments. It provides a single pane of glass to manage infrastructure and services across multiple cloud providers.Some key capabilities and benefits of Mist.io include:Multi-cloud infrastructure management - Mist allows you...
Mist.io image
Logentries icon

Logentries

Logentries is a cloud-based log management service that provides log aggregation, real-time log analysis and visualization, intelligent alerting, and log archive search. Some key features include:Real-time streaming of log data from servers, cloud platforms, networks, web apps, mobile apps etc.Powerful analytics to visualize trends, statistics, frequences etc. in your log...
Logentries image
Sawmill icon

Sawmill

Sawmill is a powerful log analysis and reporting platform for IT administrators and developers. It collects log data from multiple sources across your infrastructure and applies intelligent parsing to extract meaningful information.With customizable dashboards and reports, Sawmill gives you visibility into application usage, user behavior, security threats, and more. Some...
Sawmill image
DebugBear icon

DebugBear

DebugBear is an integrated development environment focused on debugging and profiling Python code. It provides a rich graphical interface for stepping through code line-by-line, setting breakpoints, and inspecting the values of variables and expressions.Key features of DebugBear include:Step debugger with ability to step into functions to understand complex code execution...
DebugBear image
Site24x7 icon

Site24x7

Site24x7 is a robust website and server monitoring service used by businesses to monitor uptime, performance, and user experience of their online infrastructure. It provides a unified interface to monitor websites, web applications, servers, cloud applications, APIs, and more from a single pane of glass.Key features of Site24x7 include:Uptime and...
Site24x7 image
Glimpse icon

Glimpse

Glimpse is a free, open source raster graphics editor intended as a free software alternative to proprietary software like Adobe Photoshop. It features a number of advanced image manipulation tools that allow users to touch up, edit, transform and modify photographs and images.Some of the key features offered by Glimpse...
Glimpse image
Dotcom-Monitor icon

Dotcom-Monitor

Dotcom-Monitor is a robust website and server monitoring service used to track uptime, performance, and functionality of web-based applications and infrastructure. It works by performing automated tests from points around the world to simulate visitor traffic and identify any potential problems or outages.Key features of Dotcom-Monitor include:Uptime monitoring - Regular...
Dotcom-Monitor image
LogicMonitor icon

LogicMonitor

LogicMonitor is an infrastructure monitoring software platform that was founded in 2008. It is designed for modern, dynamic IT environments and provides organizations with visibility of their infrastructure performance and availability including networks, servers, applications and more across cloud, on-prem, hybrid and multi-cloud environments.Some key capabilities and benefits of LogicMonitor...
LogicMonitor image
Pinpoint APM icon

Pinpoint APM

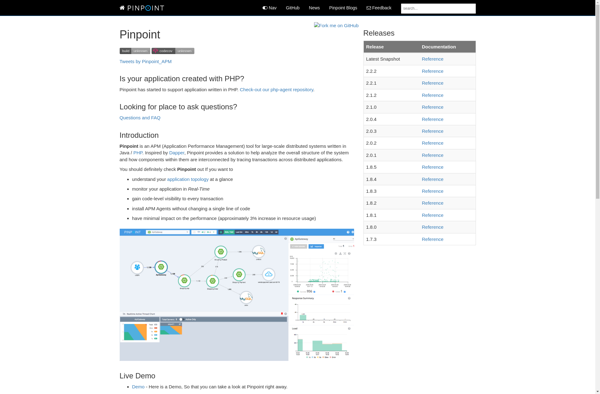
Pinpoint APM from Amazon Web Services is a full-featured application performance monitoring and management service designed for applications deployed on AWS infrastructure. It provides deep visibility into application performance, from the front-end to the database layer, to identify and troubleshoot issues quickly.Key capabilities and benefits of Pinpoint APM include:Distributed tracing...
Pinpoint APM image
Elmah.io icon

Elmah.io

elmah.io is a cloud-based error logging and monitoring service designed specifically for .NET web applications. It provides an easy way to log errors and exceptions from ASP.NET applications and API services and view them in a web-based dashboard for troubleshooting.Key features of elmah.io include:Seamless integration with ASP.NET apps via NuGet...
Elmah.io image
PgDash icon

PgDash

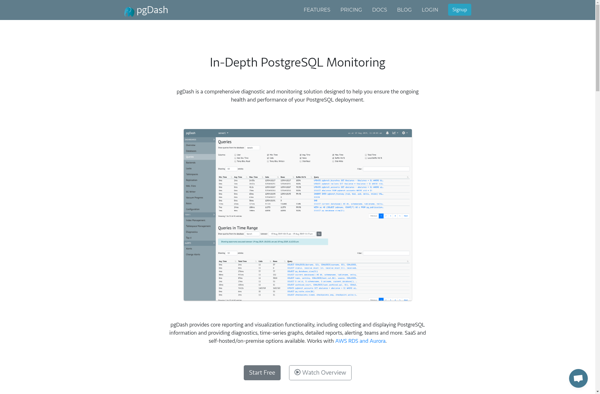
pgDash is an open-source web-based dashboard and insights tool specifically designed for PostgreSQL databases. It provides developers, DBAs, and analysts with visualizations, metrics, and query stats to help monitor and optimize PostgreSQL database performance.Some key features of pgDash include:Graphs and metrics for visually tracking PostgreSQL load, connections, queries, indexes, locks,...
PgDash image
Uptrends icon

Uptrends

Uptrends is a comprehensive web monitoring and analytics platform used by businesses to monitor the uptime, performance, and usage of their websites and applications. The software provides several key capabilities:Uptime monitoring - Continuously check website and application availability and get alerted about downtime events. Uptrends tests sites globally from over...
Uptrends image
GlitchTip icon

GlitchTip

GlitchTip is a free online multimedia creation tool used to make animated memes, comics, and short videos. It features an intuitive drag-and-drop interface that allows anyone to easily customize templates with images, text, stickers, effects, and more.Some key features of GlitchTip include:Huge library of animated meme, comic, and video templates...
GlitchTip image
NodeQuery icon

NodeQuery

NodeQuery is an open-source Java library that provides an easy way to query graph databases like Neo4j. It uses a fluent API to construct Cypher queries, allowing developers to retrieve nodes and relationships from the graph without writing raw Cypher.Some key features of NodeQuery include:Fluent API for constructing database queriesSupports...
Treblle icon

Treblle

Treblle is an API analytics and debugging platform designed specifically for developers and engineering teams. It allows you to easily monitor, troubleshoot, and optimize your APIs.Some key features and benefits of Treblle:Automatic API monitoring - Treblle automatically detects and starts monitoring your API traffic out of the box without complex...
Treblle image
Rails Performance icon

Rails Performance

Rails Performance is an open source Ruby gem created to help developers optimize the speed and performance of Ruby on Rails web applications. It analyzes various aspects of a Rails codebase to detect possible bottlenecks or inefficient code that could be slowing down page load times.Some of the main features...
Rails Performance image
SeaLion icon

SeaLion

SeaLion is an open-source, cross-platform text editor and integrated development environment (IDE). It runs on Windows, macOS, and Linux operating systems.With support for hundreds of programming and markup languages, SeaLion provides developers with syntax highlighting, autocompletion, code linting, debugging tools, version control integration, and many other features to enhance productivity.Some...
SeaLion image
SpeedCurve icon

SpeedCurve

SpeedCurve is a comprehensive web performance monitoring and optimization platform designed to help companies improve the speed and user experience of their websites and web applications. It provides the following key capabilities:Page load timing metrics - SpeedCurve tracks page load times from various geographic locations on both desktop and mobile,...
SpeedCurve image
Blackfire.io icon

Blackfire.io

Blackfire.io is a comprehensive web profiling solution and PHP debugger for inspecting application performance and code efficiency. It captures detailed timing metrics and execution context on server requests to identify performance issues and optimize web apps.Key features of Blackfire.io include:Identifying slow code paths and bottlenecksMonitoring impact of code changes on...
Blackfire.io image
Sitespeed.io icon

Sitespeed.io

Sitespeed.io is an open source web performance monitoring and testing tool. It simulates website visitors from different locations and network connections to test real-world visitor experiences.Key features include:Tests website speed from multiple geographic locationsSimulates different network connections (broadband, 3G, etc.)Generates detailed metrics like Time to First Byte, Start Render, Speed...
Sitespeed.io image
WebmasterSidekick icon

WebmasterSidekick

WebmasterSidekick is a comprehensive SEO software suite designed to help website owners and marketers improve their site's search engine rankings and organic traffic.Key features include:Keyword research - Discover high-potential keywords using volume, competition, and other data.Backlink analysis - Identify both good and bad backlinks pointing to your site.Website auditing -...
WebmasterSidekick image
Moesif icon

Moesif

Moesif is an API analytics and monitoring platform designed to help companies understand user behavior and identify issues quickly. It captures comprehensive metadata, logs and monitors API traffic between applications, services, and users to provide deep insights into usage, errors, demographics and more.Key features of Moesif include:Automatic API traffic capturing...
Moesif image
MachMetrics icon

MachMetrics

MachMetrics is an open source web analytics application that can be self-hosted as an alternative to services like Google Analytics. Some key features and benefits of MachMetrics include:100% self-hosted - you have complete data ownership and control over the tracking code and data collectionVisits, pages, referrers, campaigns and custom tracking...
MachMetrics image
HappyApps icon

HappyApps

HappyApps is a growing suite of apps focused on productivity, creativity, and joy. At its core is a note-taking app that goes beyond basic text to allow doodling, embedding images and links, recording audio notes, and more. Tight integration with the task manager app enables users to easily turn notes...
CatchJS icon

CatchJS

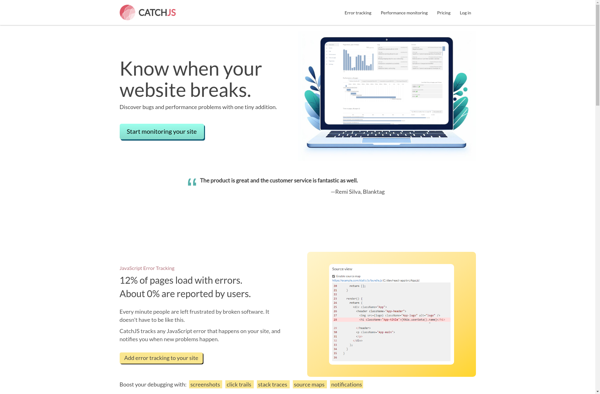
CatchJS is an open-source JavaScript testing framework designed for testing JavaScript code. It allows developers to write tests using a natural syntax that reads like plain English. Key features of CatchJS include:Lightweight and fast - CatchJS has a small footprint and is optimized for speed.Easy to learn and use -...
CatchJS image
FusionReactor icon

FusionReactor

FusionReactor is a powerful performance monitoring and profiling solution designed specifically for Java applications. It gives developers unprecedented visibility into the real-time performance and behavior of Java web and application servers.Some key features of FusionReactor include:Real-time monitoring of response times, throughput, memory usage, bottlenecks and moreDrill-down diagnostics to pinpoint the...
FusionReactor image
Wavefront by VMware icon

Wavefront by VMware

Wavefront by VMware is a scalable, high-performance metrics monitoring and analytics platform delivered through an end-to-end SaaS solution. It provides real-time granular visibility across complex, modern cloud environments.Key capabilities and benefits of Wavefront include:Ability to collect and analyze metrics and events data from various sources like containers, microservices, cloud platforms...
Wavefront by VMware image
VividCortex icon

VividCortex

VividCortex is a comprehensive database monitoring and analytics platform designed specifically for MySQL, PostgreSQL, MongoDB, Redis, and other popular databases. It provides unparalleled visibility into your database workload, queries, performance issues, and trends.Key features of VividCortex include:Real-time monitoring of all database queries, with full query details and execution statisticsVisual explain...
VividCortex image
Skylight.io icon

Skylight.io

Skylight.io is a SaaS monitoring and troubleshooting platform built specifically for engineers. It enables developers to understand and improve application performance through automated instrumentation that collects key metrics, traces, and logs. By analyzing this data, Skylight reveals where apps are spending time and what's making them slow.Some key capabilities and...
Skylight.io image
AlertFox Website Monitoring icon

AlertFox Website Monitoring

AlertFox is a comprehensive website and server monitoring service designed to track website and application availability and performance from locations across the globe. It provides real-time monitoring of websites, web applications, APIs, and servers to detect outages and performance issues.Key features of AlertFox include:Uptime monitoring - Regular checks are performed...
CoScale icon

CoScale

CoScale is a monitoring and analytics platform purpose-built for containers and microservices environments. It provides deep visibility into dynamic container infrastructures to help optimize performance, availability, and efficiency.Key features of CoScale include:Auto-discovery of containers and microservices - CoScale automatically detects all containers and microservices across clusters and cloud environments.Container-native metrics...
2 Steps icon

2 Steps

2 Steps is a basic video editing software aimed at beginner or amateur video editors who need to perform simple edits on their footage. It comes with a clean and intuitive interface that allows users to import media, trim clips, stitch together multiple shots, and add common enhancements without needing...
2 Steps image
Hyperic icon

Hyperic

Hyperic is an open source IT management and monitoring software designed to provide broad visibility and control across physical, virtual and cloud environments. It can automatically discover infrastructure and applications, measure availability and performance, detect problems, correlate events and facilitate rapid troubleshooting.Key features of Hyperic include:Automatic discovery and mapping of...
Hyperic image
Gear5 icon

Gear5

Gear5 is a to-do list and personal task manager application for Windows. It provides a simple yet powerful way to stay organized and productive.With Gear5, users can create tasks and to-do items, set due dates and reminders, organize with tags and priorities, and track productivity with built-in statistics and charts....
Concurix icon

Concurix

Concurix is an open-source automated testing platform designed for software developers. It allows dev teams to systematically test product features and measure performance to improve software quality over time.Key capabilities include:Automated testing of application features to detect regressionsPerformance tracking of features like page load times, API calls, etc.Dashboards and alerts...
Concurix image
Anturis icon

Anturis

Anturis is an open-source infrastructure monitoring platform that allows organizations to monitor their servers, networks, and applications. It has an intuitive dashboard that provides visibility into the health and performance of IT infrastructure.Some key features of Anturis include:Monitoring of servers, virtual machines, containers, cloud services, applications, databases, and moreCustomizable alerts...
Anturis image
Logmatic.io icon

Logmatic.io

Logmatic.io is a cloud-based log management and analytics platform designed for developers and IT teams. It provides the ability to aggregate logs and events from across an infrastructure into a single location for analysis and troubleshooting.Key features of Logmatic.io include:Real-time streaming of logs and events using a variety of collection...
Logmatic.io image
SteelCentral icon

SteelCentral

SteelCentral is a comprehensive network and application performance monitoring platform designed by Riverbed Technology. It provides end-to-end visibility into network and application performance to help IT teams quickly identify and troubleshoot issues before they impact end users and the business.Key capabilities and benefits of SteelCentral include:Unified visibility - Get a...
SteelCentral image
Trace by RisingStack icon

Trace by RisingStack

Trace by RisingStack is an open-source application monitoring and debugging platform designed specifically for Node.js applications. It allows developers to gain deep visibility into their Node.js apps to identify and resolve performance issues and errors.Key features of Trace include:Performance metrics - Trace captures critical metrics like response times, memory usage,...
Trace by RisingStack image
OpsDash icon

OpsDash

OpsDash is an open-source IT dashboard and monitoring solution designed for teams to visualize critical information about their infrastructure and applications. It provides real-time visibility into system metrics, application performance, log events, and network health to improve situational awareness.Key features of OpsDash include:Customizable dashboards to monitor infrastructure, apps, services, and...
OpsDash image
Statance icon

Statance

Statance is a business intelligence and data analytics software designed for business users to analyze, visualize, explore, and share insights from their data. It provides an intuitive drag and drop interface to easily create interactive dashboards and reports without coding. Users can connect Statance to a wide variety of data...
Statance image
Mothership icon

Mothership

Mothership is a cloud-based project management and collaboration software designed for agile teams. It provides a variety of features to help organize work and enable effective teamwork:Task management with kanban boards to visualize work status and progressFile sharing and cloud storage to centralize team documents and filesTime tracking to monitor...
Mothership image
Atatus icon

Atatus

Atatus is a comprehensive application performance monitoring and error tracking software designed for web and mobile applications. It provides real-time monitoring of key application performance metrics like response time, throughput, API errors etc. to help developers identify and fix performance issues rapidly.Key features of Atatus include:Error and exception tracking -...
Atatus image
Loom Systems icon

Loom Systems

Loom Systems is an AI-powered IT operations (AIOps) platform designed to help enterprises monitor, analyze, and optimize their IT environments. The software uses machine learning and predictive analytics to provide actionable insights across infrastructure and applications.Key capabilities and benefits of Loom Systems include:Intelligent monitoring and alerting - Automatically detects anomalies...
InternetVista Monitoring icon

InternetVista Monitoring

internetVista Monitoring is a robust IT infrastructure monitoring platform designed to provide organizations with complete visibility and control over their networks, servers, applications, and services. It features an intuitive web-based interface for monitoring performance and availability across physical, virtual, and cloud environments.Key capabilities of internetVista Monitoring include:Customizable dashboards with graphs,...
InternetVista Monitoring image
TraceView icon

TraceView

TraceView is a performance profiling tool specifically for Android applications. It allows developers to trace method calls and measure execution times to understand where an app may be spending too much time or encountering bottlenecks.Some key features of TraceView include:Method tracing to see which methods are called and how long...
TraceView image
CloudScreener icon

CloudScreener

CloudScreener is a multi-cloud security and compliance monitoring solution designed to provide organizations with continuous visibility and control across their cloud environments. It supports the major cloud platforms - AWS, Azure, and GCP.Key features of CloudScreener include:Automated inventory of cloud assets across services like EC2, S3, VPC, Storage Accounts, SQL...
CloudScreener image
PA Server Monitor icon

PA Server Monitor

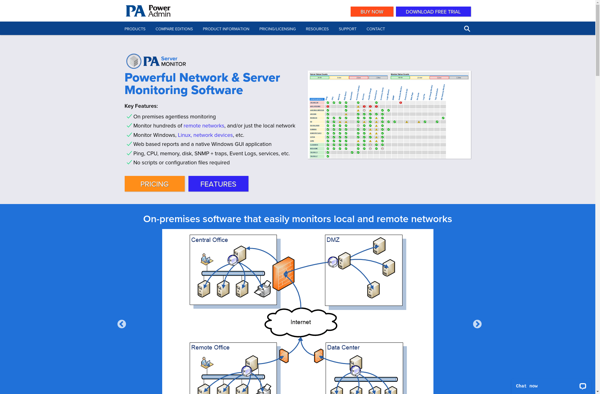
PA Server Monitor is an open-source server monitoring and alerting software used by system administrators to keep track of servers, network devices, services, and applications in real-time. It features automatic server discovery and monitoring, flexible notifications via email, SMS, messaging apps, etc., customizable reporting, dashboards, mobile apps for iPhone/iPad and...
PA Server Monitor image
Opbeat icon

Opbeat

Opbeat is an application performance monitoring and error tracking software designed specifically for modern web applications and services. It gives development and ops teams real-time insight into the performance, health, and errors occurring within their cloud-native apps and microservices.Key features of Opbeat include:Performance monitoring - Track response times, throughput, memory...
Opbeat image
ErrorFeed icon

ErrorFeed

ErrorFeed is a robust error and exception monitoring software used by developers and IT teams to track errors and crashes in web and mobile applications. It gives real-time alerting about app issues and integrates seamlessly with platforms like JavaScript, .NET, Java, Ruby, PHP and more.Key features include:Real-time error monitoring with...
ErrorFeed image
Cavisson NetDiagnostics icon

Cavisson NetDiagnostics

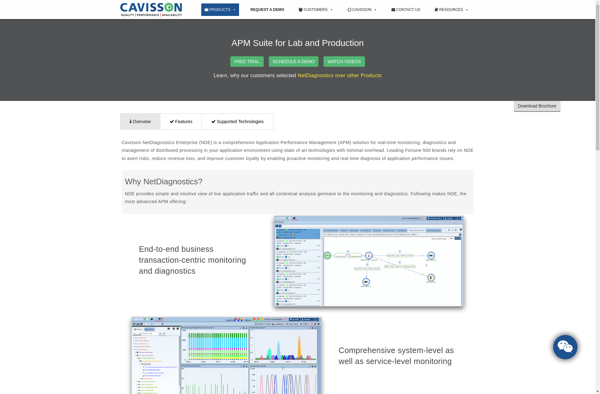
Cavisson NetDiagnostics is a comprehensive network performance monitoring and diagnostics software designed to provide real-time visibility into critical business services, transactions, applications and infrastructure. The software helps IT teams to proactively detect, diagnose and resolve issues before they impact users and customers.Key features and capabilities include:Automatic discovery and mapping of...
Cavisson NetDiagnostics image
RoRvsWild icon

RoRvsWild

RoRvsWild is an open-source web application framework written in the Ruby programming language. It follows the popular model-view-controller (MVC) architectural pattern and emphasizes convention over configuration, rapid application development, and the don't repeat yourself (DRY) principle.Some key features of RoRvsWild include:A routing system that connects HTTP requests to controllers and...
RoRvsWild image
SynTraffic icon

SynTraffic

SynTraffic is an open-source, cross-platform traffic generation and network simulation application. It provides a graphical user interface and command-line interface to configure and generate various types of traffic profiles and network conditions for testing purposes.Some of the key features of SynTraffic include:Ability to simulate traffic such as HTTP, HTTPS, FTP,...
SynTraffic image
Cloudkick icon

Cloudkick

Cloudkick is a robust cloud server monitoring and management platform designed to give operations and development teams greater visibility and control over their infrastructure. It provides real-time monitoring, alerting, automation and analytics for Linux servers running on major cloud platforms like AWS, Rackspace, Linode and more.With Cloudkick, users can keep...
JavOSize icon

JavOSize

javOSize is an open source Java profiler designed to analyze memory usage and object allocation in Java applications. It provides useful insights for Java developers to understand and optimize their application's memory utilization.Key features of javOSize include:Detailed reporting on memory consumption, including per-class and package breakdownsTracking of object allocation rates...
Mission Control by Grafite icon

Mission Control by Grafite

Mission Control by Grafite is a cloud-based project management and work management solution designed for agencies, creative teams, and professional services firms. It provides a variety of features to help teams plan and organize client projects, assign tasks, manage workflows, track time and productivity, share files, invoice clients, and more.Key...
Blue Matador icon

Blue Matador

Blue Matador is a cloud-native monitoring and observability platform optimized for modern infrastructure and applications. It provides real-time monitoring, alerting, log analysis, incident investigation, and integration with popular DevOps tools and services.Key features of Blue Matador include:Automatic discovery of infrastructure, containers, services, and applicationsOut-of-the-box monitoring for common technologies like Kubernetes,...
Blue Matador image
Yeller icon

Yeller

Yeller is a comprehensive social media management platform designed to help brands and agencies collaborate, plan, publish, engage, and analyze performance all in one place.Key features of Yeller include:Unified content calendar with ability to schedule posts to multiple social accountsContent ideation tools such as content curation and planningCollaboration workflows so...
Yeller image
Servers and network monitoring icon

Servers and network monitoring

Servers and network monitoring software is designed to help IT teams keep track of the health, performance, and availability of critical infrastructure like servers, websites, applications, and networks. This type of software provides a centralized way to monitor performance metrics, track systems availability, and receive alerts when potential issues arise.Key...
SpectrumApp icon

SpectrumApp

SpectrumApp is a versatile digital painting and drawing software application designed for Windows and macOS platforms. It offers an intuitive and customizable workspace for artists and graphics designers of all skill levels.Key features of SpectrumApp include:Over 1000 realistic and naturalistic brushes spanning a variety of digital media types like oils,...
LiveMon icon

LiveMon

LiveMon is an open-source network monitoring and management software. It allows administrators to monitor the health and performance of computer networks and servers in real-time. Key features of LiveMon include:Real-time metrics on network bandwidth utilization, latency, uptime and moreAutomatic detection of network outages and performance degradationVisual mapping of network topology...
LiveMon image
Packetbeat icon

Packetbeat

Packetbeat is a lightweight network packet analyzer and monitoring tool developed by Elastic. It is used to monitor network traffic in real-time, providing visibility into packets flowing through a network. Here are some key capabilities of Packetbeat:Captures live network traffic from the wire and analyzes protocols like HTTP, MySQL, Redis,...
Packetbeat image