Packetbeat is an open source network packet analyzer and monitoring tool. It captures network traffic in real-time and provides visibility into packets flowing through the network. Packetbeat can analyze application-layer protocols like HTTP, MySQL, and Redis to monitor performan
Packetbeat: Open Source Network Packet Analyzer & Monitoring Tool
Packetbeat is an open source network packet analyzer and monitoring tool that captures network traffic in real-time, providing visibility into packets flowing through the network.
What is Packetbeat?
Packetbeat is a lightweight network packet analyzer and monitoring tool developed by Elastic. It is used to monitor network traffic in real-time, providing visibility into packets flowing through a network. Here are some key capabilities of Packetbeat:
Captures live network traffic from the wire and analyzes protocols like HTTP, MySQL, Redis, DNS, and more.
Performs deep analysis of application layer protocols to understand network communication between applications.
Tracks response times, errors, bandwidth usage and other metrics at the application layer to monitor performance.
Indexes packet data into Elasticsearch to enable further analysis and visualizations.
Open source tool designed for efficiency to handle high packet rates without dropping packets.
Plugin architecture allows extending protocol support as needed.
Lightweight agent allowing deployment to edge servers with minimal overhead.
Overall, Packetbeat serves as a network packet analyzer to provide visibility into all communications between clients and servers across an environment. It goes beyond basic packet capture to enable monitoring and analytics for specific applications and protocols.
Packetbeat Features
Features
Real-time network packet capture and analysis
Monitors application-layer protocols like HTTP, MySQL, Redis, etc
Collects metrics like response times, errors, bandwidth
Provides insights into network traffic and performance
Built-in dashboards and visualizations
Alerting and anomaly detection capabilities
Lightweight and efficient agent-based architecture
Pricing
Open Source
Pros
Open source and free to use
Easy to install and configure
Minimal impact on network performance
Supports many common protocols out of the box
Good for monitoring microservices and distributed systems
Integrates well with Elasticsearch, Logstash and Kibana
Cons
Not as feature-rich as commercial alternatives
Limited built-in reporting capabilities
Requires expertise to customize dashboards and alerts
New Relic is a comprehensive application performance monitoring and observability platform used by software engineers to monitor, troubleshoot, and optimize their applications and infrastructure. It provides real-time visibility into the performance, health, and usage of applications running in cloud, hybrid, and on-premises environments.Key features of New Relic include:Application monitoring -...
What Is AppDynamics?AppDynamics is an application performance monitoring (APM) and observability platform owned by Cisco. It provides real-time visibility into application performance, user experience, and business impact across complex distributed systems.Key FeaturesAppDynamics automatically discovers and maps application topology — every service, database, API call, and third-party dependency. It traces individual...
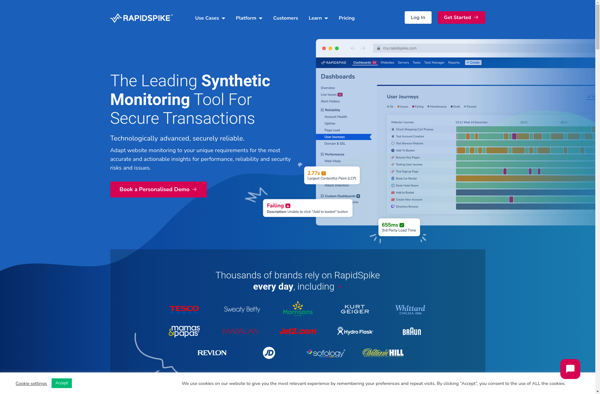
RapidSpike is a powerful yet easy-to-use load and performance testing tool designed for testing the performance of web applications. It provides the ability to simulate hundreds or thousands of concurrent virtual users to generate realistic workloads on web apps to identify performance bottlenecks and ensure applications can handle expected traffic.Key...
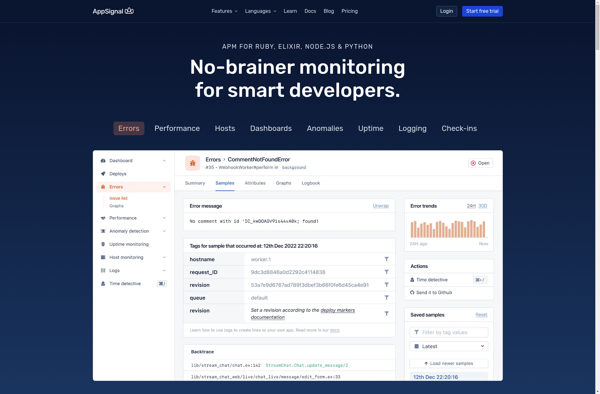
AppSignal is a robust application performance monitoring and error tracking tool designed specifically for Ruby and Elixir applications. It gives detailed insights into the performance of Rails, Sinatra, Padrino and Grape apps to help debug errors and monitor key metrics.Key features include:Performance metrics - AppSignal measures request times, database queries,...
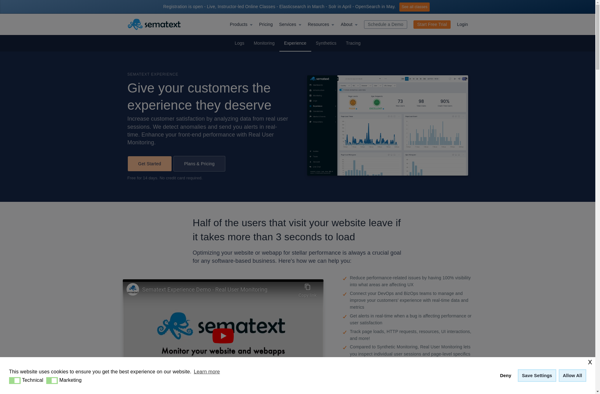
Sematext Experience is an open source application performance monitoring and infrastructure monitoring solution designed to provide real-time visibility into the performance and health of web applications, servers, containers, and databases.Key features include:Monitoring of response time, throughput, errors for web applicationsTracing for analyzing request flows and pinpointing bottlenecksMetrics and alerts for...
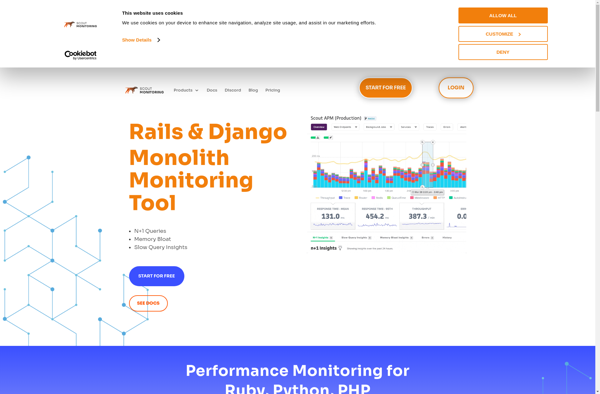
Scout APM is an advanced application performance monitoring and tracing solution designed specifically for Ruby, Python, PHP, Java, and Node.js applications. It provides deep visibility into the performance of web applications by tracing transactions end-to-end, allowing developers to pinpoint bottlenecks quickly.Key features of Scout APM include:Easy-to-use UI showing an overview...
VividCortex is a comprehensive database monitoring and analytics platform designed specifically for MySQL, PostgreSQL, MongoDB, Redis, and other popular databases. It provides unparalleled visibility into your database workload, queries, performance issues, and trends.Key features of VividCortex include:Real-time monitoring of all database queries, with full query details and execution statisticsVisual explain...
TraceView is a performance profiling tool specifically for Android applications. It allows developers to trace method calls and measure execution times to understand where an app may be spending too much time or encountering bottlenecks.Some key features of TraceView include:Method tracing to see which methods are called and how long...
IQLECT is an e-learning software used to create interactive online courses and training programs. It provides a suite of tools that enable teachers, professors, corporate trainers and instructional designers to author rich and engaging learning content.Key features of IQLECT include:Intuitive course authoring tools to build interactive lessons, assessments, simulations, scenarios...