TraceView is a performance profiling tool for Android apps. It provides method tracing to help understand where an app spends its time and identify performance bottlenecks.
TraceView: Performance Profiling Tool for Android Apps
A performance profiling tool for Android apps, providing method tracing to help understand app performance and identify bottlenecks
What is TraceView?
TraceView is a performance profiling tool specifically for Android applications. It allows developers to trace method calls and measure execution times to understand where an app may be spending too much time or encountering bottlenecks.
Some key features of TraceView include:
Method tracing to see which methods are called and how long each takes to execute
Flame graphs to visually identify hot code paths
Call charts to understand relationships between methods
Ability to profile UI performance to pinpoint sluggish UI rendering
CPU usage data
SQLite query analysis
Integrated with DDMS for collecting trace data from emulator or device
By using TraceView to profile an Android app, developers can gain insight into where optimization efforts should be focused to improve performance and responsiveness. It integrates with the Android debugging pipeline to make collection tracing data easy. The visualization and reporting features allow quick analysis to find and address bottlenecks.
TraceView Features
Features
Method tracing to identify performance bottlenecks
New Relic is a comprehensive application performance monitoring and observability platform used by software engineers to monitor, troubleshoot, and optimize their applications and infrastructure. It provides real-time visibility into the performance, health, and usage of applications running in cloud, hybrid, and on-premises environments.Key features of New Relic include:Application monitoring -...
What Is AppDynamics?AppDynamics is an application performance monitoring (APM) and observability platform owned by Cisco. It provides real-time visibility into application performance, user experience, and business impact across complex distributed systems.Key FeaturesAppDynamics automatically discovers and maps application topology — every service, database, API call, and third-party dependency. It traces individual...
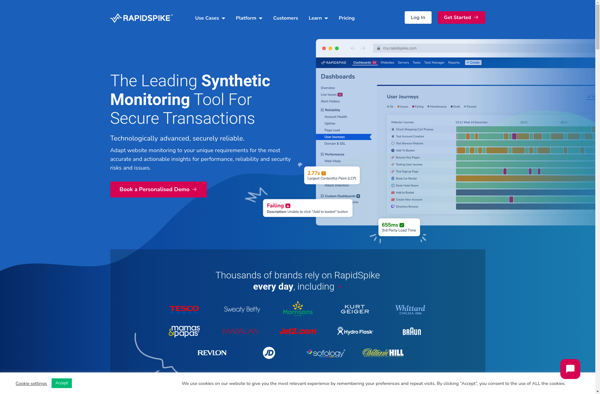
RapidSpike is a powerful yet easy-to-use load and performance testing tool designed for testing the performance of web applications. It provides the ability to simulate hundreds or thousands of concurrent virtual users to generate realistic workloads on web apps to identify performance bottlenecks and ensure applications can handle expected traffic.Key...
Glowroot is an open source Java Application Performance Monitoring (APM) tool for diagnosing performance issues in Java applications. It is designed specifically for monitoring Java applications in production environments with minimal overhead.Some key features of Glowroot include:Real-time monitoring of response time, throughput, error rates etc.Transaction tracing showing exact timings across...
Rails Performance is an open source Ruby gem created to help developers optimize the speed and performance of Ruby on Rails web applications. It analyzes various aspects of a Rails codebase to detect possible bottlenecks or inefficient code that could be slowing down page load times.Some of the main features...
OverOps is a production monitoring and debugging platform optimized for Java and .NET applications. It gives software teams code-level visibility into production failures and exceptions to help quickly identify, triage, and resolve issues.Key features of OverOps include:Real-time error and exception reporting - OverOps captures and analyzes failures as they occur...
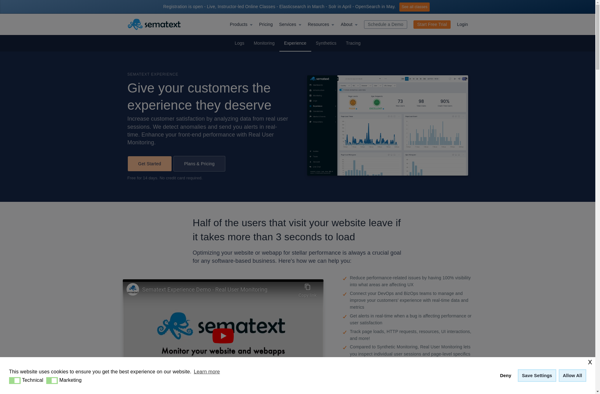
Sematext Experience is an open source application performance monitoring and infrastructure monitoring solution designed to provide real-time visibility into the performance and health of web applications, servers, containers, and databases.Key features include:Monitoring of response time, throughput, errors for web applicationsTracing for analyzing request flows and pinpointing bottlenecksMetrics and alerts for...
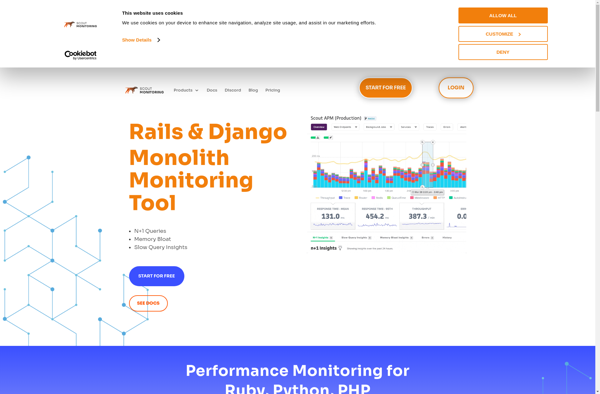
Scout APM is an advanced application performance monitoring and tracing solution designed specifically for Ruby, Python, PHP, Java, and Node.js applications. It provides deep visibility into the performance of web applications by tracing transactions end-to-end, allowing developers to pinpoint bottlenecks quickly.Key features of Scout APM include:Easy-to-use UI showing an overview...
Trace by RisingStack is an open-source application monitoring and debugging platform designed specifically for Node.js applications. It allows developers to gain deep visibility into their Node.js apps to identify and resolve performance issues and errors.Key features of Trace include:Performance metrics - Trace captures critical metrics like response times, memory usage,...
IQLECT is an e-learning software used to create interactive online courses and training programs. It provides a suite of tools that enable teachers, professors, corporate trainers and instructional designers to author rich and engaging learning content.Key features of IQLECT include:Intuitive course authoring tools to build interactive lessons, assessments, simulations, scenarios...
Packetbeat is a lightweight network packet analyzer and monitoring tool developed by Elastic. It is used to monitor network traffic in real-time, providing visibility into packets flowing through a network. Here are some key capabilities of Packetbeat:Captures live network traffic from the wire and analyzes protocols like HTTP, MySQL, Redis,...