VividCortex is a database monitoring and analytics platform designed specifically for MySQL, PostgreSQL, MongoDB, Redis, and other databases. It provides deep visibility into database workload, queries, performance issues, and trends.
Monitor and analyze database performance, identify bottlenecks and optimize queries with VividCortex, a powerful platform for MySQL, PostgreSQL, MongoDB, Redis and more.
What is VividCortex?
VividCortex is a comprehensive database monitoring and analytics platform designed specifically for MySQL, PostgreSQL, MongoDB, Redis, and other popular databases. It provides unparalleled visibility into your database workload, queries, performance issues, and trends.
Key features of VividCortex include:
Real-time monitoring of all database queries, with full query details and execution statistics
Visual explain plans showing index usage, table scans, joins etc.
Analytics to identify slow queries, blocked queries, and other performance issues
Custom dashboard builder to visualize database metrics and trends
Alerting when predefined thresholds are crossed for latency, errors, saturation etc.
Historic analysis showing seasonal usage patterns and performance regression
Unlike infrastructure monitoring tools, VividCortex is purpose-built for databases and provides much deeper insight compared to native database tools. Companies use VividCortex to optimize database performance, troubleshoot issues faster, and plan capacity for growth and changing needs.
VividCortex Features
Features
Real-time database monitoring and analytics
Query performance insights
Workload visualization and analysis
Alerts for slow queries and performance issues
Historical performance trending
Custom dashboards
Pricing
Subscription-Based
Pros
Detailed visibility into database workload and performance
Identify slow queries and bottlenecks
Track database trends over time
Customizable dashboards and alerts
Works with major databases like MySQL, PostgreSQL, MongoDB
Cloud-based SaaS model for easy setup
Cons
Can get expensive for large or complex environments
Limited support for less common databases
May require additional overhead for full functionality
Datadog is a SaaS-based monitoring and analytics platform for cloud applications. It provides complete visibility into dynamic infrastructures by aggregating metrics, events, and logs from servers, containers, databases, tools, and services. This allows Dev and Ops teams to quickly solve performance problems, prove the root cause of software bugs, spot...
New Relic is a comprehensive application performance monitoring and observability platform used by software engineers to monitor, troubleshoot, and optimize their applications and infrastructure. It provides real-time visibility into the performance, health, and usage of applications running in cloud, hybrid, and on-premises environments.Key features of New Relic include:Application monitoring -...
What Is AppDynamics?AppDynamics is an application performance monitoring (APM) and observability platform owned by Cisco. It provides real-time visibility into application performance, user experience, and business impact across complex distributed systems.Key FeaturesAppDynamics automatically discovers and maps application topology — every service, database, API call, and third-party dependency. It traces individual...
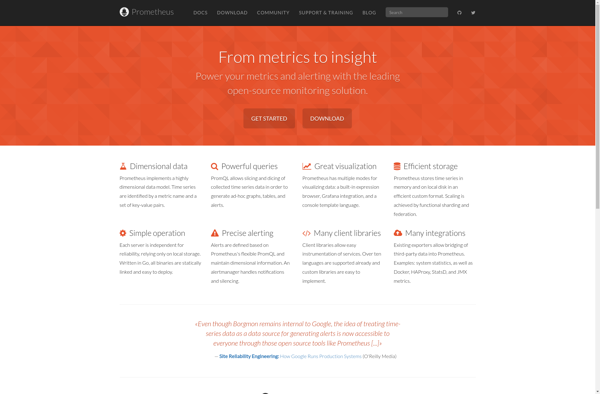
Prometheus is an open source monitoring and alerting system optimized for containerized environments like Kubernetes. It provides real-time visibility into applications, infrastructure, and services running in an environment.Prometheus works by scraping and storing time series data from various systems and services. It collects metrics from targets using either a pull...
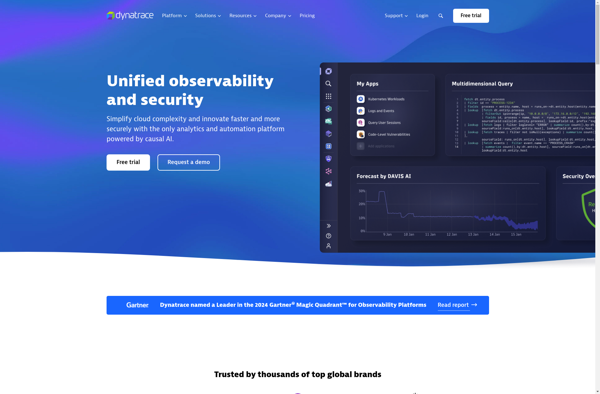
Dynatrace is an AI-powered observability platform designed for monitoring complex, dynamic multi-cloud environments. It automatically discovers and maps full-stack dependencies to provide an end-to-end visualization of the entire ecosystem.Key capabilities and benefits of Dynatrace include:Automatic and intelligent observability - Performs automatic baselining and anomaly detection using deterministic AI to surface...
Raygun is a comprehensive error and crash reporting software designed to help developers monitor and fix issues in production web and mobile applications. It gives complete visibility into software errors and crashes, allowing teams to identify, diagnose, and resolve problems before customers are impacted.Some key features of Raygun include:Real-time error...
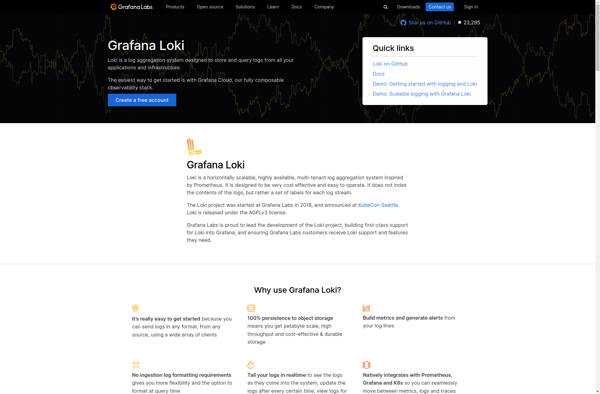
Grafana Loki is an open source logging aggregation system designed specifically for cloud native infrastructure. It is optimized for saving, indexing, and querying logs through labels and streams rather than unstructured text.Some key features of Grafana Loki include:Horizontally scalable - built on top of Prometheus's remote write protocol.Log queries -...
Monitis is a cloud-based IT infrastructure monitoring and management platform designed for businesses and IT teams. It provides a single dashboard to monitor the uptime, performance, and health of servers, applications, networks, websites, and other IT infrastructure components.Key features of Monitis include:Uptime and synthetic monitoring to track availability and response...
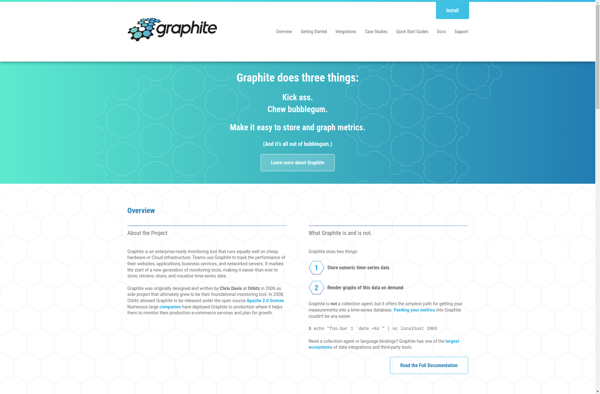
Graphite is an open-source monitoring and graphing tool used to store, visualize, and monitor time-series data from servers, applications, or other systems. It is designed to be highly scalable and robust for handling high volume metric collection and visualization.Some key features and components of Graphite include:Carbon - a high-performance service...
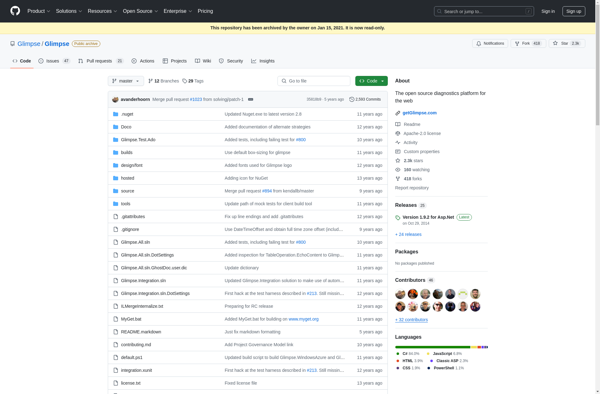
Glimpse is a free, open source raster graphics editor intended as a free software alternative to proprietary software like Adobe Photoshop. It features a number of advanced image manipulation tools that allow users to touch up, edit, transform and modify photographs and images.Some of the key features offered by Glimpse...
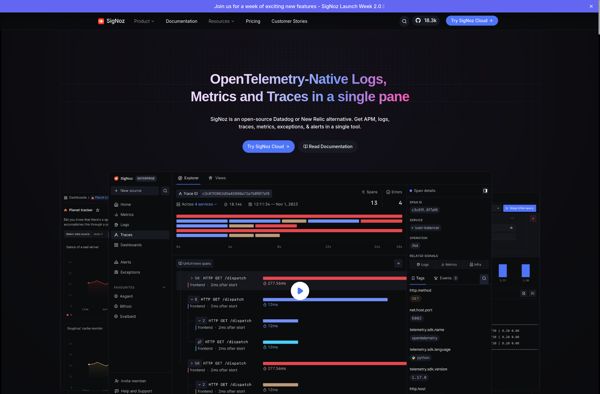
SigNoz is an open-source alternative to commercial Application Performance Monitoring (APM) tools like DataDog, New Relic, and Dynatrace. It is a cloud-native observability platform designed specifically for monitoring modern distributed systems.Some key capabilities and benefits of SigNoz include:Lightweight and optimized for microservices, serverless, and Kubernetes environmentsCollects metrics, traces, and logs...
Packetbeat is a lightweight network packet analyzer and monitoring tool developed by Elastic. It is used to monitor network traffic in real-time, providing visibility into packets flowing through a network. Here are some key capabilities of Packetbeat:Captures live network traffic from the wire and analyzes protocols like HTTP, MySQL, Redis,...