AppSignal is a performance monitoring and error tracking tool for Ruby and Elixir apps. It provides insights into application performance to help debug errors and monitor metrics.
AppSignal: Performance Monitoring and Error Tracking
AppSignal is a performance monitoring and error tracking tool for Ruby and Elixir apps. It provides insights into application performance to help debug errors and monitor metrics.
What is AppSignal?
AppSignal is a robust application performance monitoring and error tracking tool designed specifically for Ruby and Elixir applications. It gives detailed insights into the performance of Rails, Sinatra, Padrino and Grape apps to help debug errors and monitor key metrics.
Key features include:
Performance metrics - AppSignal measures request times, database queries, external requests and more to spotlight slow code.
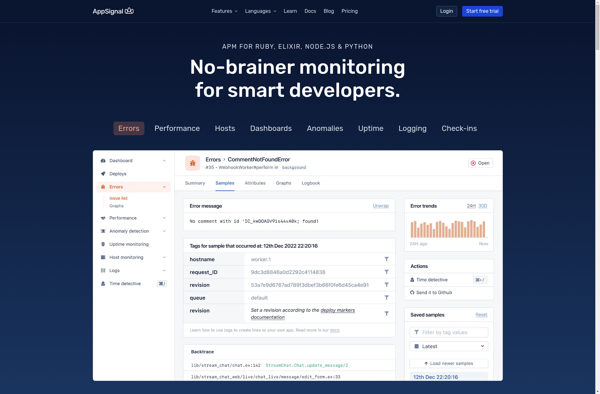
Error monitoring - Errors are grouped together to see their frequency and details to fix them quickly.
Stack traces - Full stack traces make it easy to pinpoint the source of errors.
Host metrics - System-level metrics like CPU, memory and load averages provide more context.
Custom metrics - Create your own metrics to monitor business-specific data.
Correlation with ops data - Correlate performance with deployment, host and other data.
Notifications - Get alerted when specific errors occur or performance degrades.
AppSignal works by auto-instrumenting your apps via a gem to track performance data with minimal setup. Data is viewable through the AppSignal web app dashboard. It integrates with popular tools like JIRA, Slack, PagerDuty and more.
Datadog is a SaaS-based monitoring and analytics platform for cloud applications. It provides complete visibility into dynamic infrastructures by aggregating metrics, events, and logs from servers, containers, databases, tools, and services. This allows Dev and Ops teams to quickly solve performance problems, prove the root cause of software bugs, spot...
New Relic is a comprehensive application performance monitoring and observability platform used by software engineers to monitor, troubleshoot, and optimize their applications and infrastructure. It provides real-time visibility into the performance, health, and usage of applications running in cloud, hybrid, and on-premises environments.Key features of New Relic include:Application monitoring -...
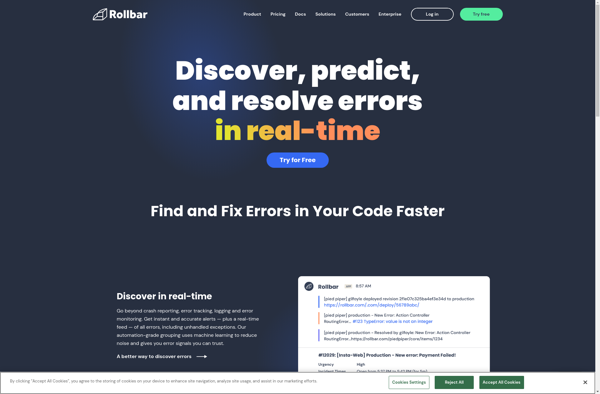
What Is Rollbar?Rollbar is an error monitoring and crash reporting platform for software applications. It captures, aggregates, and alerts on errors in real-time across web, mobile, and backend applications, helping development teams find and fix bugs faster.Key FeaturesRollbar automatically groups similar errors together, reducing noise from thousands of individual error...
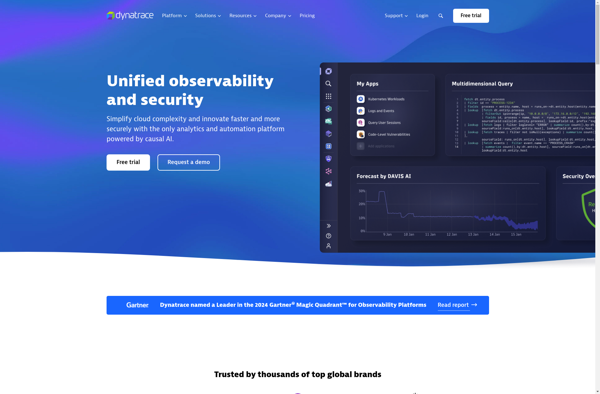
Dynatrace is an AI-powered observability platform designed for monitoring complex, dynamic multi-cloud environments. It automatically discovers and maps full-stack dependencies to provide an end-to-end visualization of the entire ecosystem.Key capabilities and benefits of Dynatrace include:Automatic and intelligent observability - Performs automatic baselining and anomaly detection using deterministic AI to surface...
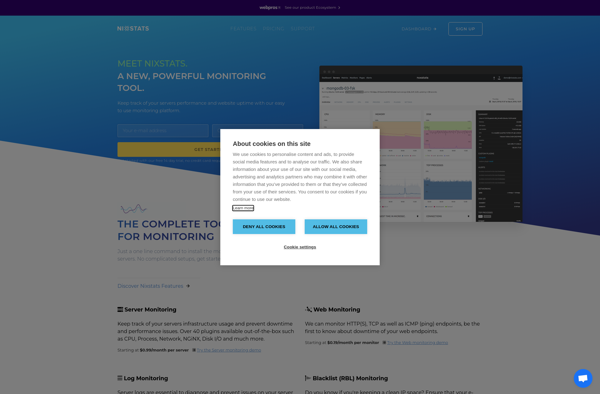
NIXStats is an open-source web analytics application that allows website owners to track and analyze traffic to their sites. It provides detailed statistics on visits, unique visitors, page views, bounce rates, traffic sources, and more. As an open-source platform, NIXStats places no restrictions on data collection or analysis and avoids...
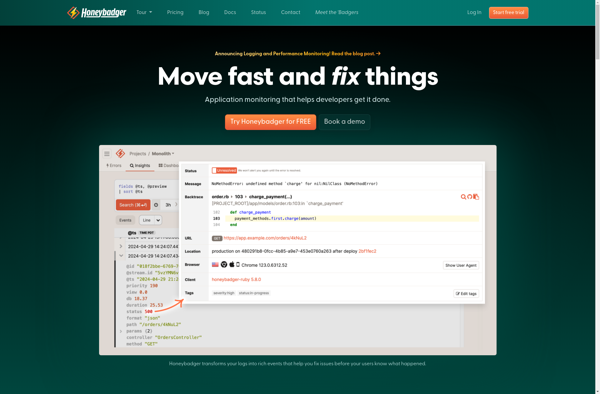
Honeybadger is a developer tool that helps Ruby and Python developers monitor their applications for errors and downtime. It gives developers visibility into application issues in real-time by sending alerts whenever errors occur or when the app goes down.Some key features of Honeybadger include:Exception and error monitoring - Get notified...
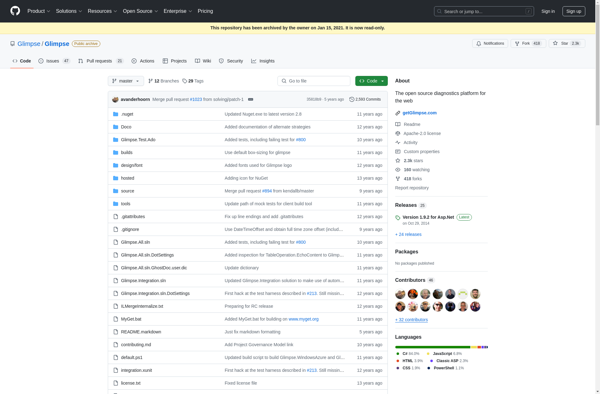
Glimpse is a free, open source raster graphics editor intended as a free software alternative to proprietary software like Adobe Photoshop. It features a number of advanced image manipulation tools that allow users to touch up, edit, transform and modify photographs and images.Some of the key features offered by Glimpse...
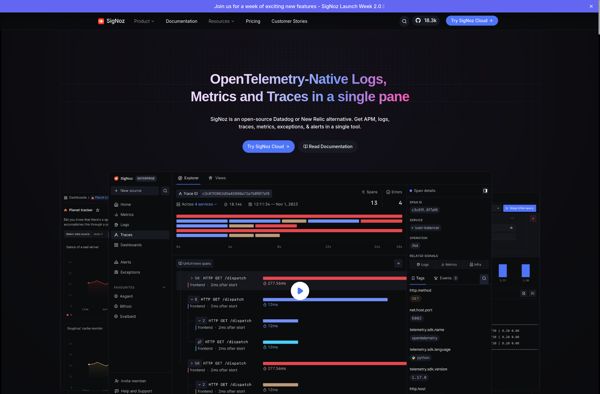
SigNoz is an open-source alternative to commercial Application Performance Monitoring (APM) tools like DataDog, New Relic, and Dynatrace. It is a cloud-native observability platform designed specifically for monitoring modern distributed systems.Some key capabilities and benefits of SigNoz include:Lightweight and optimized for microservices, serverless, and Kubernetes environmentsCollects metrics, traces, and logs...
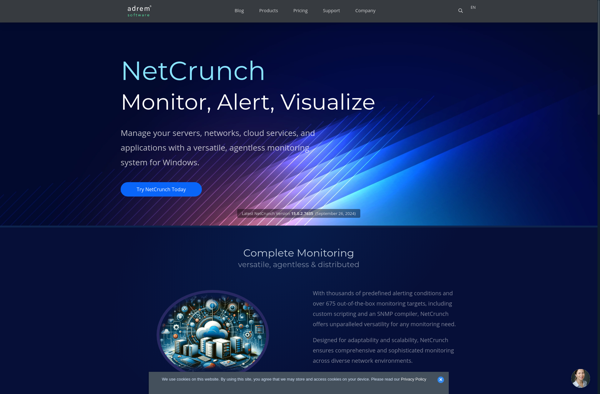
NetCrunch is an all-in-one network monitoring and management system designed for networks of all sizes. It provides real-time monitoring, alerting, reporting, mapping, and analysis of IT infrastructure performance and availability.Key features of NetCrunch include:Auto-discovery of devices on the networkMonitoring of network performance metrics like bandwidth utilization, latency, errors, etc.Monitoring of...
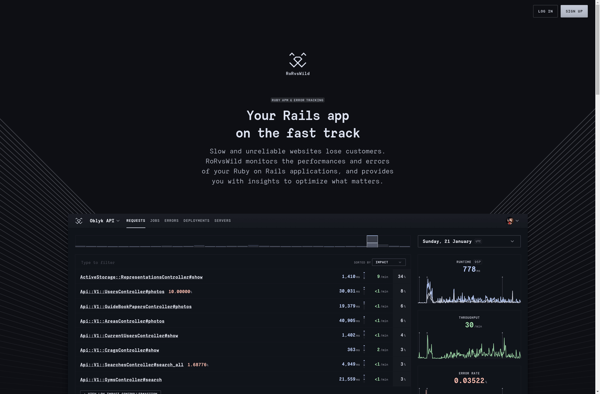
RoRvsWild is an open-source web application framework written in the Ruby programming language. It follows the popular model-view-controller (MVC) architectural pattern and emphasizes convention over configuration, rapid application development, and the don't repeat yourself (DRY) principle.Some key features of RoRvsWild include:A routing system that connects HTTP requests to controllers and...
javOSize is an open source Java profiler designed to analyze memory usage and object allocation in Java applications. It provides useful insights for Java developers to understand and optimize their application's memory utilization.Key features of javOSize include:Detailed reporting on memory consumption, including per-class and package breakdownsTracking of object allocation rates...
Packetbeat is a lightweight network packet analyzer and monitoring tool developed by Elastic. It is used to monitor network traffic in real-time, providing visibility into packets flowing through a network. Here are some key capabilities of Packetbeat:Captures live network traffic from the wire and analyzes protocols like HTTP, MySQL, Redis,...