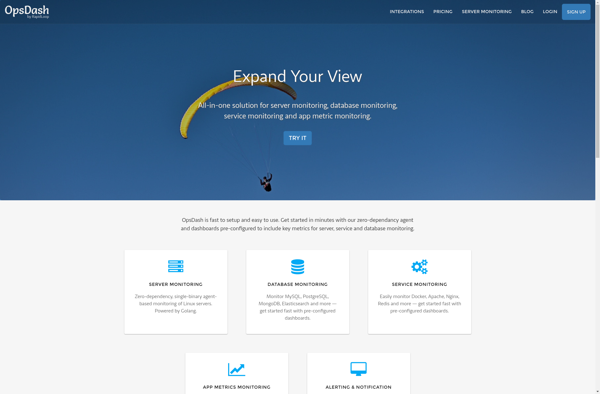
OpsDash is an open-source IT dashboard and monitoring tool for teams. It provides visibility into system metrics, application performance, log events, and network health. OpsDash allows tracking issues, setting alerts, creating reports, and more.
OpsDash: Open-Source IT Dashboard and Monitoring Tools
OpsDash provides visibility into system metrics, application performance, log events, and network health, allowing tracking of issues, setting alerts, creating reports, and more.
What is OpsDash?
OpsDash is an open-source IT dashboard and monitoring solution designed for teams to visualize critical information about their infrastructure and applications. It provides real-time visibility into system metrics, application performance, log events, and network health to improve situational awareness.
Key features of OpsDash include:
Customizable dashboards to monitor infrastructure, apps, services, and business KPIs
Visual tracking of metrics, logs, and events for troubleshooting issues
Flexible alerting rules and notifications via email, Slack, PagerDuty
Analyze trends with historical data and generate reports
Role-based access control for teams and integration with LDAP
Scalable architecture built on modern tech like React, Node.js, GraphQL, and PostgreSQL
OpsDash enables dev, ops, and engineering teams to stay on top of critical systems, gain visibility into problems, rapidly detect and respond to incidents, and improve service reliability. Its intuitive UI and open-source model makes monitoring accessible for technology teams.
OpsDash Features
Features
Real-time monitoring and visualization of system metrics
Application performance monitoring
Log event monitoring and analysis
Network health monitoring
Alert management and notification
Custom dashboards and reporting
Integrations with various data sources
Open-source and customizable
Pricing
Open Source
Pros
Comprehensive monitoring capabilities
Open-source and highly customizable
Easy to set up and use
Provides visibility into system health
Supports a wide range of data sources
Cons
Limited out-of-the-box integrations compared to some commercial tools
Requires some technical expertise to set up and configure
May require additional resources for large-scale deployments
Datadog is a SaaS-based monitoring and analytics platform for cloud applications. It provides complete visibility into dynamic infrastructures by aggregating metrics, events, and logs from servers, containers, databases, tools, and services. This allows Dev and Ops teams to quickly solve performance problems, prove the root cause of software bugs, spot...
New Relic is a comprehensive application performance monitoring and observability platform used by software engineers to monitor, troubleshoot, and optimize their applications and infrastructure. It provides real-time visibility into the performance, health, and usage of applications running in cloud, hybrid, and on-premises environments.Key features of New Relic include:Application monitoring -...
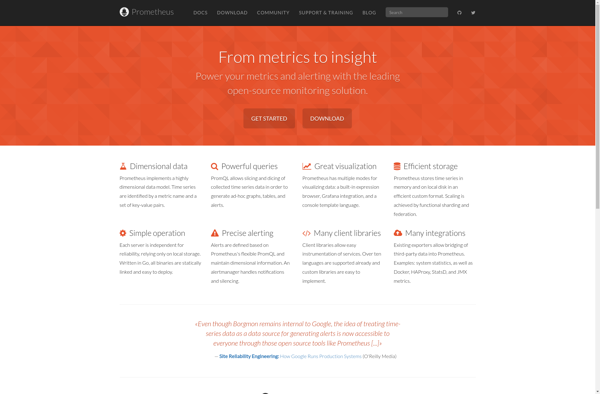
Prometheus is an open source monitoring and alerting system optimized for containerized environments like Kubernetes. It provides real-time visibility into applications, infrastructure, and services running in an environment.Prometheus works by scraping and storing time series data from various systems and services. It collects metrics from targets using either a pull...
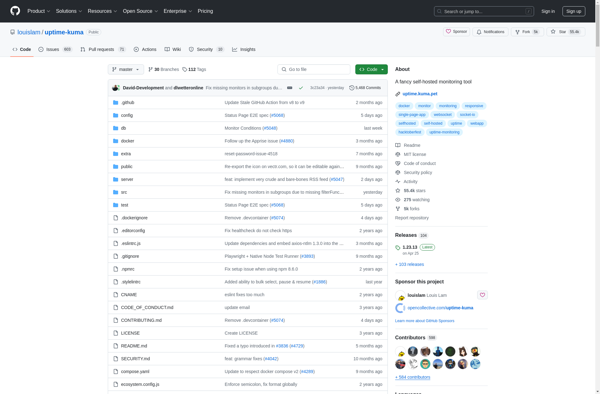
Uptime Kuma is an open-source, self-hosted monitoring application that allows you to monitor your websites, APIs, and servers from your own infrastructure. It provides uptime monitoring, SSL certificate checks, ping checks, and more to ensure your critical services are up and running.Some key features of Uptime Kuma include:Easy to install...
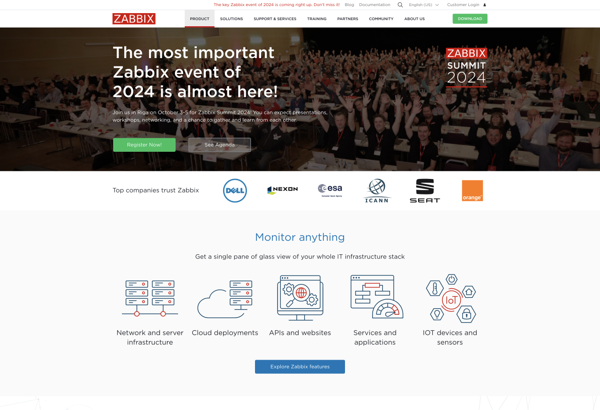
Zabbix is an enterprise-class open source distributed monitoring solution for networks and applications. It is designed to monitor and track the status of various network services, servers, and other network hardware. It provides real-time graphing, alerting, visualization and reporting for monitoring IT infrastructure performance and availability.Some of the key features...
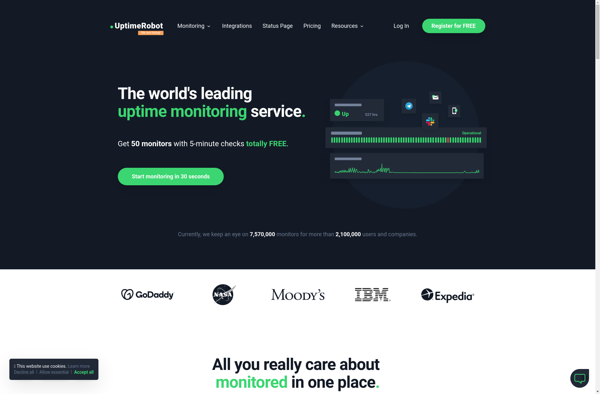
UptimeRobot is a popular website and server monitoring service used by over 1 million users. It provides comprehensive uptime monitoring and alerting for websites, web applications, APIs, and servers.Some key features of UptimeRobot include:Uptime monitoring - Continuous monitoring of website availability from global locations. Alerts you if your site goes...
Nagios is an open source computer system and network monitoring software application. It watches hosts and services, sends notifications when things go wrong, and alerts users when issues come up. Nagios helps system administrators detect and resolve IT infrastructure problems before they affect critical business processes.Some key capabilities of Nagios...
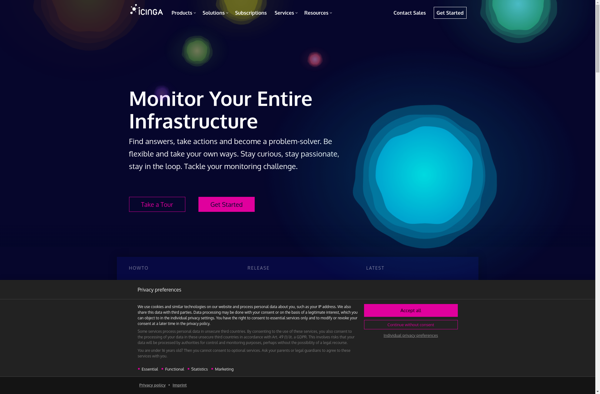
Icinga is an open source monitoring system which checks the availability of your network resources, notifies users of outages, and generates performance data for reporting. It is a fork of the popular Nagios monitoring system and aims to improve upon some of its shortcomings.Some key features of Icinga include:Monitoring of...
Grafana Loki is an open source logging aggregation system designed specifically for cloud native infrastructure. It is optimized for saving, indexing, and querying logs through labels and streams rather than unstructured text.Some key features of Grafana Loki include:Horizontally scalable - built on top of Prometheus's remote write protocol.Log queries -...
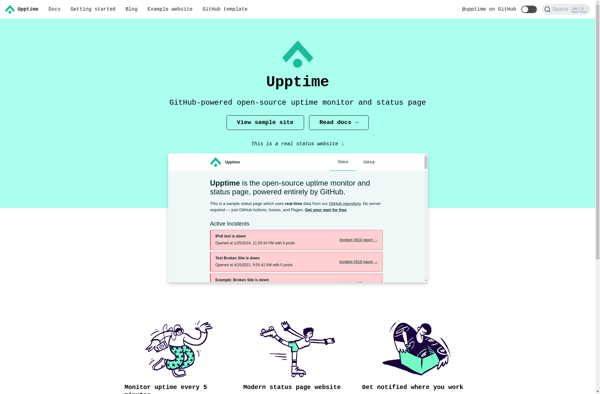
Upptime is an open-source application for monitoring uptime and status of websites, APIs, and applications. It is designed to be easy to use, customizable, and lightweight.Some key features of Upptime include:Uptime monitoring of HTTP, HTTPS, DNS, TCP, and ICMP servicesCustomizable public status pages showing real-time and historical uptime dataStatus page...
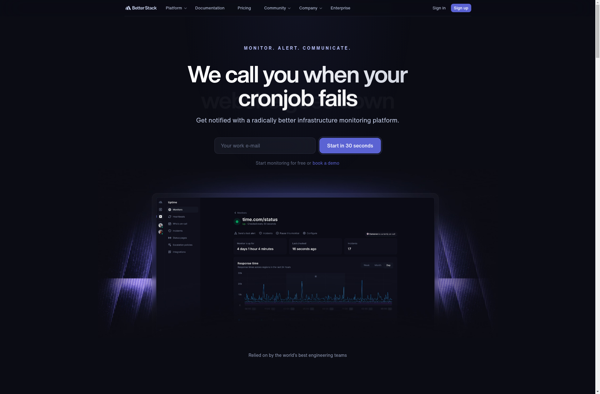
Better Stack Uptime is a comprehensive website and application monitoring service designed to provide full visibility into the availability and performance of your online properties. It offers a range of monitoring options to check uptime, SSL certificates, site speed, and more from locations around the world.Key features include:Uptime monitoring from...
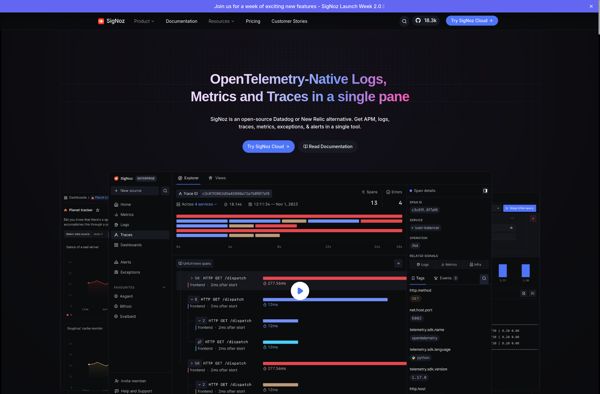
SigNoz is an open-source alternative to commercial Application Performance Monitoring (APM) tools like DataDog, New Relic, and Dynatrace. It is a cloud-native observability platform designed specifically for monitoring modern distributed systems.Some key capabilities and benefits of SigNoz include:Lightweight and optimized for microservices, serverless, and Kubernetes environmentsCollects metrics, traces, and logs...