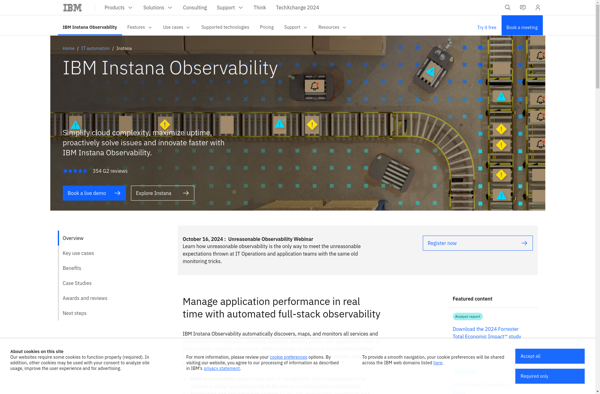
Instana is an application performance monitoring and observability platform optimized for modern cloud-native applications. It provides automatic tracing, metrics, and logs for microservices and containerized applications.
Instana: Application Performance Monitoring and Observability
Application performance monitoring and observability platform for modern cloud-native applications, with automatic tracing, metrics, and logs for microservices and containerized apps.
What is Instana?
Instana is an application performance monitoring and observability platform designed specifically for modern cloud-native applications. It provides automatic end-to-end tracing, metrics, and logs collection for microservices and containerized applications running on Kubernetes, Docker, AWS, Azure and Google Cloud.
Key capabilities and benefits of Instana include:
Automated discovery of microservices and infrastructure
Distributed tracing showing high-level application flows as well as granular service-to-service communication
Visualization of call graphs and flame graphs to identify performance bottlenecks
Real-time monitoring of key application and infrastructure metrics
Analytics for rapid troubleshooting of performance issues
Infrastructure monitoring covering hosts, containers, databases and more
Support for OpenTelemetry for custom instrumentation
Tight integration with Kubernetes, Docker and cloud platforms
Simple and lightweight agent-based installation without code changes
Instana targets engineering teams running cloud native applications that want deep observability into distributed systems without extra effort. Its automation and ease of use makes it well-suited for microservices applications using continuous delivery.
Instana Features
Features
Automatic discovery of microservices and infrastructure
Distributed tracing and visualization
Application performance monitoring
Infrastructure monitoring
Alerting and anomaly detection
Log management and analysis
Pricing
Subscription-Based
Pros
Easy and fast setup
Works well for containerized and microservices apps
Powerful APM and distributed tracing
Intuitive UI and visualizations
Good integration with Kubernetes and cloud platforms
Datadog is a SaaS-based monitoring and analytics platform for cloud applications. It provides complete visibility into dynamic infrastructures by aggregating metrics, events, and logs from servers, containers, databases, tools, and services. This allows Dev and Ops teams to quickly solve performance problems, prove the root cause of software bugs, spot...
New Relic is a comprehensive application performance monitoring and observability platform used by software engineers to monitor, troubleshoot, and optimize their applications and infrastructure. It provides real-time visibility into the performance, health, and usage of applications running in cloud, hybrid, and on-premises environments.Key features of New Relic include:Application monitoring -...
What Is AppDynamics?AppDynamics is an application performance monitoring (APM) and observability platform owned by Cisco. It provides real-time visibility into application performance, user experience, and business impact across complex distributed systems.Key FeaturesAppDynamics automatically discovers and maps application topology — every service, database, API call, and third-party dependency. It traces individual...
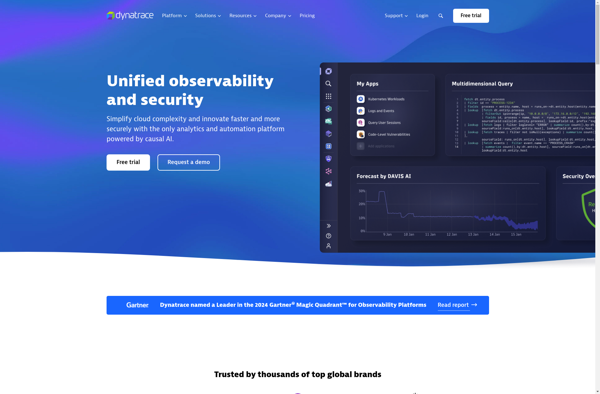
Dynatrace is an AI-powered observability platform designed for monitoring complex, dynamic multi-cloud environments. It automatically discovers and maps full-stack dependencies to provide an end-to-end visualization of the entire ecosystem.Key capabilities and benefits of Dynatrace include:Automatic and intelligent observability - Performs automatic baselining and anomaly detection using deterministic AI to surface...
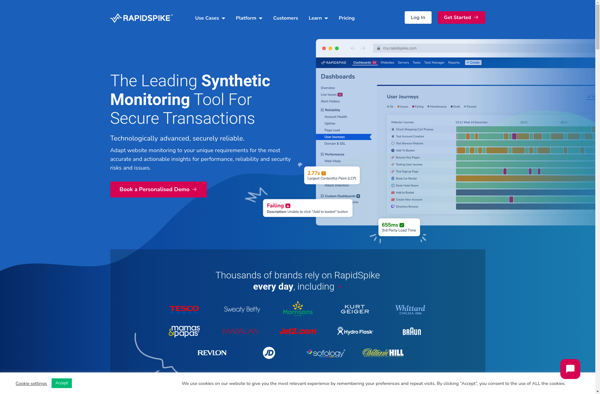
RapidSpike is a powerful yet easy-to-use load and performance testing tool designed for testing the performance of web applications. It provides the ability to simulate hundreds or thousands of concurrent virtual users to generate realistic workloads on web apps to identify performance bottlenecks and ensure applications can handle expected traffic.Key...
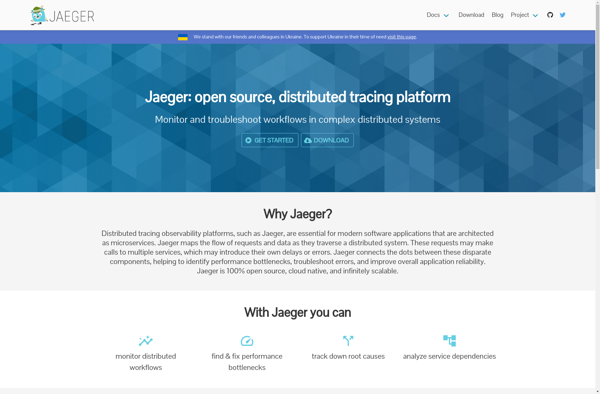
Jaeger is an open source, end-to-end distributed tracing system used for monitoring and troubleshooting microservices-based distributed systems. It provides insight into transaction latency, errors, and dependencies across microservices architectures.Key features of Jaeger include:Distributed context propagation - Jaeger instruments microservices to propagate context/tracing data across process boundariesDistributed transaction monitoring - Jaeger...
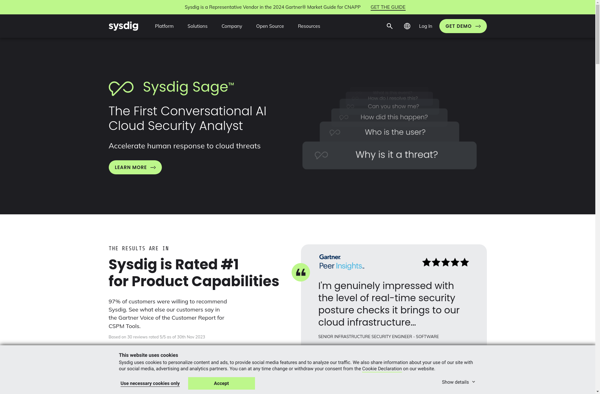
Sysdig is an open source troubleshooting and observability platform designed for containers, Kubernetes, and cloud-native infrastructure. It gives developers, SREs, and infrastructure engineers total visibility into applications, microservices, containers, hosts, networks, and public cloud services to monitor, troubleshoot, and secure complex modern environments.Key capabilities and benefits of Sysdig include:Real-time visibility...
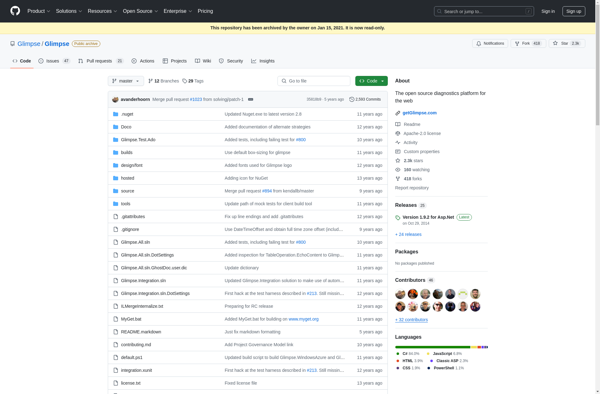
Glimpse is a free, open source raster graphics editor intended as a free software alternative to proprietary software like Adobe Photoshop. It features a number of advanced image manipulation tools that allow users to touch up, edit, transform and modify photographs and images.Some of the key features offered by Glimpse...
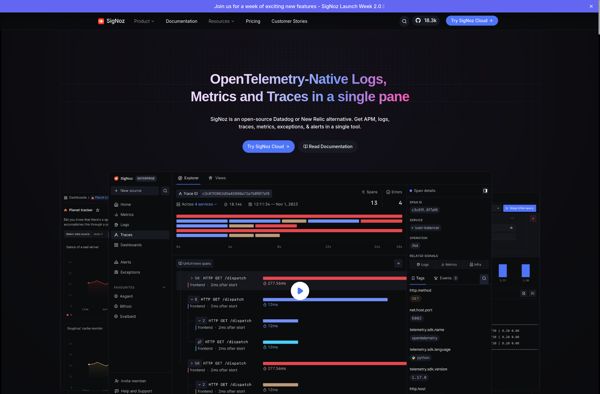
SigNoz is an open-source alternative to commercial Application Performance Monitoring (APM) tools like DataDog, New Relic, and Dynatrace. It is a cloud-native observability platform designed specifically for monitoring modern distributed systems.Some key capabilities and benefits of SigNoz include:Lightweight and optimized for microservices, serverless, and Kubernetes environmentsCollects metrics, traces, and logs...
2 Steps is a basic video editing software aimed at beginner or amateur video editors who need to perform simple edits on their footage. It comes with a clean and intuitive interface that allows users to import media, trim clips, stitch together multiple shots, and add common enhancements without needing...