Logmatic.io is a cloud-based log management and analytics platform designed for developers and IT teams. It allows you to collect, analyze, and visualize logs and events from across your infrastructure in real-time.
Logmatic.io: Cloud-based Log Management and Analytics Platform
A cloud-based log management and analytics platform designed for developers and IT teams, allowing real-time collection, analysis, and visualization of logs and events from across your infrastructure.
What is Logmatic.io?
Logmatic.io is a cloud-based log management and analytics platform designed for developers and IT teams. It provides the ability to aggregate logs and events from across an infrastructure into a single location for analysis and troubleshooting.
Key features of Logmatic.io include:
Real-time streaming of logs and events using a variety of collection methods
Customizable log parsing to extract fields and metadata
Powerful search and filters for analyzing log data
Custom analytics and visualizations such as charts and dashboards
Alerting based on log data
Integrations with many popular tools and services
Scalable cloud infrastructure with high reliability
Logmatic.io is designed to give developers and IT teams insight into application and infrastructure performance, stability, and security. By centralizing logs into an analytics platform, issues can be more readily identified and debugged. The dashboards and visibility Logmatic.io provides are useful for monitoring critical systems and troubleshooting problems in real-time.
Logmatic.io Features
Features
Real-time log monitoring and analytics
Log collection from various sources like apps, servers, cloud services etc
Datadog is a SaaS-based monitoring and analytics platform for cloud applications. It provides complete visibility into dynamic infrastructures by aggregating metrics, events, and logs from servers, containers, databases, tools, and services. This allows Dev and Ops teams to quickly solve performance problems, prove the root cause of software bugs, spot...
Splunk is a software platform that enables users to search, analyze, and visualize the data gathered from the infrastructure, systems, and applications of an organization. It captures, indexes, and correlates real-time data in a searchable repository from which it can generate graphs, reports, alerts, dashboards, and visualizations.Some key features and...
New Relic is a comprehensive application performance monitoring and observability platform used by software engineers to monitor, troubleshoot, and optimize their applications and infrastructure. It provides real-time visibility into the performance, health, and usage of applications running in cloud, hybrid, and on-premises environments.Key features of New Relic include:Application monitoring -...
Prometheus is an open source monitoring and alerting system optimized for containerized environments like Kubernetes. It provides real-time visibility into applications, infrastructure, and services running in an environment.Prometheus works by scraping and storing time series data from various systems and services. It collects metrics from targets using either a pull...
What Is Rollbar?Rollbar is an error monitoring and crash reporting platform for software applications. It captures, aggregates, and alerts on errors in real-time across web, mobile, and backend applications, helping development teams find and fix bugs faster.Key FeaturesRollbar automatically groups similar errors together, reducing noise from thousands of individual error...
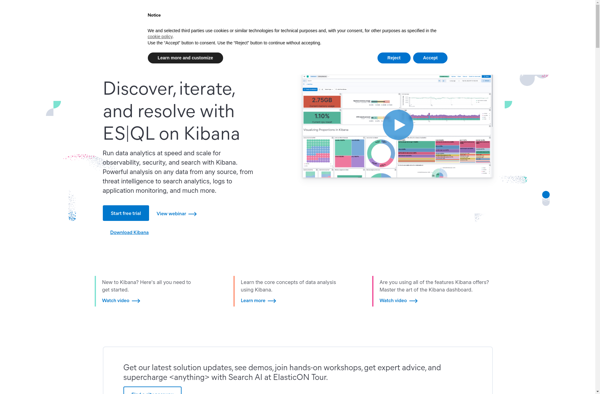
Kibana is an open source analytics and visualization platform designed to operate on top of Elasticsearch. Kibana provides search and data visualization capabilities for data indexed in Elasticsearch clusters. Some of the key capabilities and features of Kibana include:Interactive dashboards - Kibana allows users to create rich, interactive dashboards and...
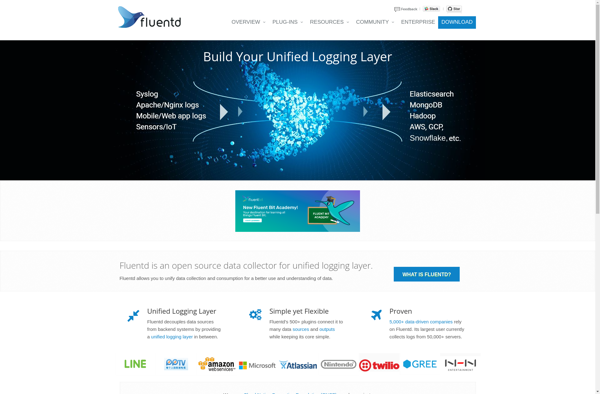
Fluentd is an open source data collector designed for processing data streams. It works by having input plugins that collect data from various sources, processing plugins that transform the data, and output plugins that send the data to various destinations.Some key features of Fluentd include:Unified logging layer - It allows...
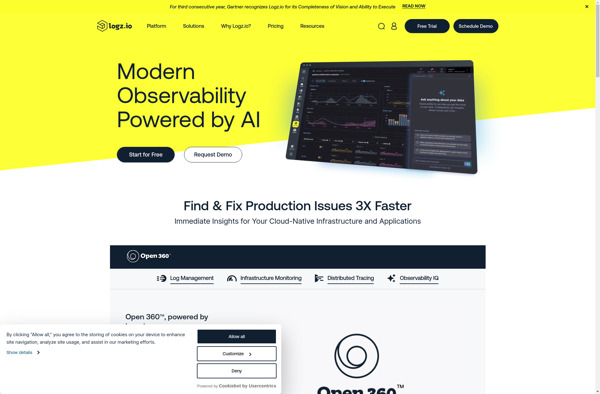
logz.io is a cloud-native log management and analytics platform designed for modern cloud-based architectures. It offers the following key capabilities:Real-time log analysis - logz.io ingests and indexes log data from any source in real-time, allowing you to search and analyze log data on-the-fly.Intelligent alerting - Configure advanced correlation rules to...
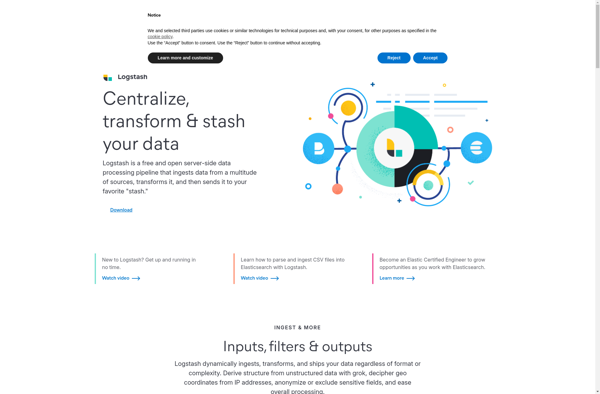
Logstash is an open source, server-side data processing pipeline that ingests data from a multitude of sources simultaneously, transforms it, and then sends it to your favorite "stash."It is typically used as part of the ELK stack (Elasticsearch, Logstash, Kibana) for logging use cases. Logstash ingest data from various input...
Graylog is an open source log management and analysis platform optimized for high volumes of machine-generated data. It collects, indexes, and analyzes log messages, events, and other time-series data from various systems and applications.Some key features and capabilities of Graylog include:Real-time processing and analysis of log data as it is...
Papertrail is a cloud-based log management and analysis platform designed for infrastructure monitoring, application troubleshooting, and compliance reporting. It aggregates log data in real-time from servers, clouds, containers, and applications into a centralized, searchable web archive.Key features of Papertrail include:Real-time log streaming - Logs are streamed to Papertrail in real-time...
Open Web Analytics (OWA) is an open source web analytics platform that you can use to track and analyze traffic on your websites. It provides a wealth of data to help you understand your visitors and make better decisions about your online marketing and content strategy.Some key features of OWA...