Sawmill is a log analysis software that provides real-time analysis of log data to monitor application and network performance. It helps identify errors, security threats, and usage trends through customizable reports and alerts.
Sawmill: Log Analysis Software for Real-Time Performance Monitoring
Sawmill is a log analysis software that provides real-time analysis of log data to monitor application and network performance. It helps identify errors, security threats, and usage trends through customizable reports and alerts.
What is Sawmill?
Sawmill is a powerful log analysis and reporting platform for IT administrators and developers. It collects log data from multiple sources across your infrastructure and applies intelligent parsing to extract meaningful information.
With customizable dashboards and reports, Sawmill gives you visibility into application usage, user behavior, security threats, and more. Some key features include:
Real-time log monitoring and alerts to flag issues
Out-of-the-box support for major log formats like Apache, IIS, MySQL, etc.
Ability to build custom parsers for proprietary log data
Interactive drill-down dashboards to analyze trends
Scheduled email reports to relevant stakeholders
Role-based access control to provide relevant views
Scalable architecture to collect and analyze terabytes of log data
Sawmill is designed to run on-premises and integrates well with SIEM, monitoring, and ITSM solutions. It provides faster insights from machine data across networks, servers, applications, security tools, and custom data sources.
Sawmill Features
Features
Real-time log analysis
Customizable dashboards and reports
Alerts for anomalies and errors
Support for wide range of log formats
Data filtering and correlation
Role-based access control
Pricing
Subscription-Based
Pay-As-You-Go
Pros
Powerful log analytics capabilities
Easy to set up and use
Scales to handle large log volumes
Integrates with many data sources
Flexible licensing options
Cons
Can be resource intensive for very large deployments
Datadog is a SaaS-based monitoring and analytics platform for cloud applications. It provides complete visibility into dynamic infrastructures by aggregating metrics, events, and logs from servers, containers, databases, tools, and services. This allows Dev and Ops teams to quickly solve performance problems, prove the root cause of software bugs, spot...
Splunk is a software platform that enables users to search, analyze, and visualize the data gathered from the infrastructure, systems, and applications of an organization. It captures, indexes, and correlates real-time data in a searchable repository from which it can generate graphs, reports, alerts, dashboards, and visualizations.Some key features and...
New Relic is a comprehensive application performance monitoring and observability platform used by software engineers to monitor, troubleshoot, and optimize their applications and infrastructure. It provides real-time visibility into the performance, health, and usage of applications running in cloud, hybrid, and on-premises environments.Key features of New Relic include:Application monitoring -...
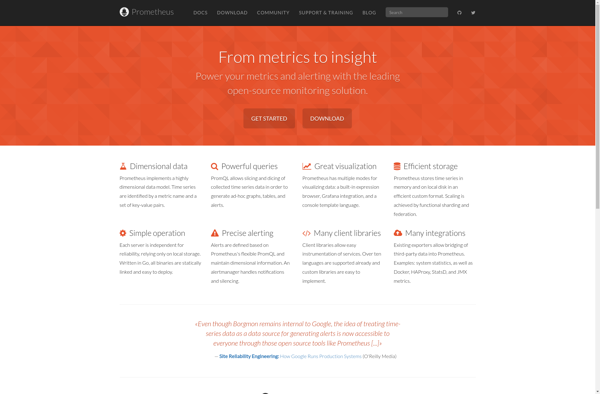
Prometheus is an open source monitoring and alerting system optimized for containerized environments like Kubernetes. It provides real-time visibility into applications, infrastructure, and services running in an environment.Prometheus works by scraping and storing time series data from various systems and services. It collects metrics from targets using either a pull...
What Is Rollbar?Rollbar is an error monitoring and crash reporting platform for software applications. It captures, aggregates, and alerts on errors in real-time across web, mobile, and backend applications, helping development teams find and fix bugs faster.Key FeaturesRollbar automatically groups similar errors together, reducing noise from thousands of individual error...
Kibana is an open source analytics and visualization platform designed to operate on top of Elasticsearch. Kibana provides search and data visualization capabilities for data indexed in Elasticsearch clusters. Some of the key capabilities and features of Kibana include:Interactive dashboards - Kibana allows users to create rich, interactive dashboards and...
Grafana is a feature-rich, open source analytics and monitoring visualization suite. It integrates tightly with a variety of database technologies like Graphite, Prometheus, InfluxDB, Elasticsearch, and more to allow for easy exploration and visualization of time series data. Some key capabilities and benefits of Grafana include:Intuitive graphical UI makes it...
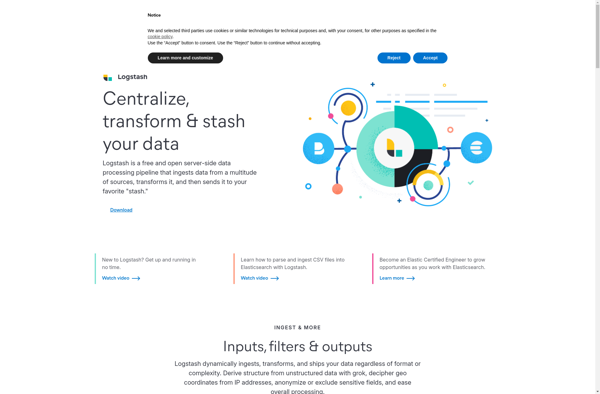
Logstash is an open source, server-side data processing pipeline that ingests data from a multitude of sources simultaneously, transforms it, and then sends it to your favorite "stash."It is typically used as part of the ELK stack (Elasticsearch, Logstash, Kibana) for logging use cases. Logstash ingest data from various input...
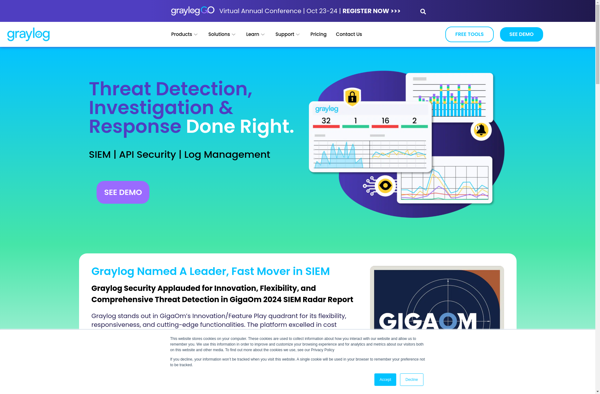
Graylog is an open source log management and analysis platform optimized for high volumes of machine-generated data. It collects, indexes, and analyzes log messages, events, and other time-series data from various systems and applications.Some key features and capabilities of Graylog include:Real-time processing and analysis of log data as it is...
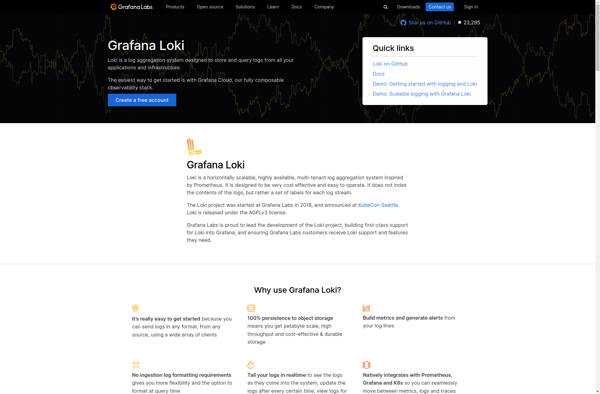
Grafana Loki is an open source logging aggregation system designed specifically for cloud native infrastructure. It is optimized for saving, indexing, and querying logs through labels and streams rather than unstructured text.Some key features of Grafana Loki include:Horizontally scalable - built on top of Prometheus's remote write protocol.Log queries -...
Octopussy is an open source log management and monitoring solution optimized for simplicity. It provides log aggregation from multiple sources, automatic parsing and analysis of log data, as well as visualization through dashboards and reports.Some key capabilities and benefits of Octopussy include:Centralized logging - Collect logs from various systems, servers,...
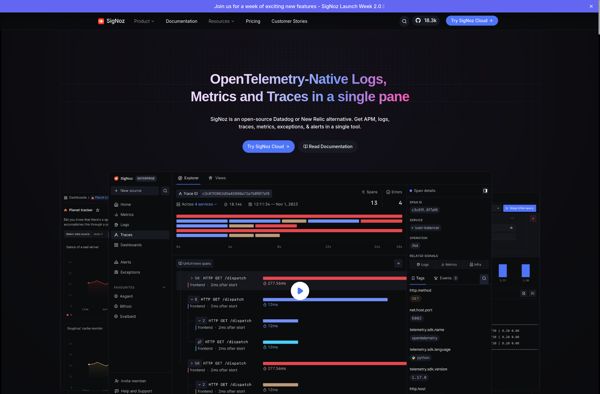
SigNoz is an open-source alternative to commercial Application Performance Monitoring (APM) tools like DataDog, New Relic, and Dynatrace. It is a cloud-native observability platform designed specifically for monitoring modern distributed systems.Some key capabilities and benefits of SigNoz include:Lightweight and optimized for microservices, serverless, and Kubernetes environmentsCollects metrics, traces, and logs...
Open Web Analytics (OWA) is an open source web analytics platform that you can use to track and analyze traffic on your websites. It provides a wealth of data to help you understand your visitors and make better decisions about your online marketing and content strategy.Some key features of OWA...