PgDash
pgDash is an open-source web-based dashboard and insights tool for PostgreSQL databases. It provides visualizations, metrics, and query stats to help developers and DBAs monitor and optimize PostgreSQL performance.
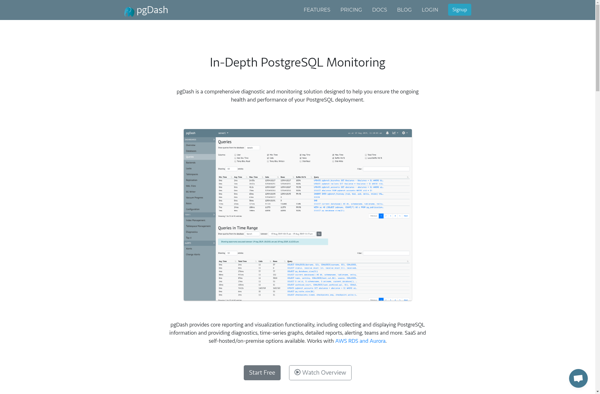
pgDash: Open-Source PostgreSQL Dashboard
An open-source web-based dashboard for monitoring and optimizing PostgreSQL performance, with visualizations, metrics, and query stats.
What is PgDash?
pgDash is an open-source web-based dashboard and insights tool specifically designed for PostgreSQL databases. It provides developers, DBAs, and analysts with visualizations, metrics, and query stats to help monitor and optimize PostgreSQL database performance.
Some key features of pgDash include:
- Graphs and metrics for visually tracking PostgreSQL load, connections, queries, indexes, locks, and more in real-time
- Insights into slow, frequent, and expensive queries that may be impacting performance
- Query stats showing execution time, calls, I/O, and more for digging deeper into database usage
- Historical trends and long-term averages, not just spot-checks
- Wait event analyzer for diagnosing PostgreSQL bottlenecks
- Auto-refreshing dashboards for continuous visibility as new data arrives
- Role-based access controls for allowing different access levels
- Easy to install and works with cloud or on-premises Postgres deployments
Overall, pgDash aims to provide PostgreSQL developers and administrators with an intuitive web interface and useful visual analytics to better understand database workload, catch issues early, and optimize long-term performance.
PgDash Features
Features
- Real-time dashboard for monitoring PostgreSQL databases
- Visualizations for key metrics like CPU usage, memory usage, query throughput, etc.
- Query stats to identify slow, frequent, and expensive queries
- Database health checks and diagnostics
- Connection and configuration info
- Works with PostgreSQL 9.3 and above
Pricing
- Open Source
Pros
Open source and free to use
Easy to set up and configure
Good for monitoring overall database health
Helpful for optimizing queries and database performance
Web-based so can access from anywhere
Cons
Limited historical data and stats
Not as full-featured as paid alternatives
Requires some knowledge of PostgreSQL to get most value
Only works with PostgreSQL databases
Official Links
Reviews & Ratings
Login to ReviewThe Best PgDash Alternatives
View all pgDash alternatives with detailed comparison →
Top Development and Database Management and other similar apps like PgDash
Datadog
Datadog is a SaaS-based monitoring and analytics platform for cloud applications. It provides complete visibility into dynamic infrastructures by aggregating metrics, events, and logs from servers, containers, databases, tools, and services. This allows Dev and Ops teams to quickly solve performance problems, prove the root cause of software bugs, spot...

New Relic
New Relic is a comprehensive application performance monitoring and observability platform used by software engineers to monitor, troubleshoot, and optimize their applications and infrastructure. It provides real-time visibility into the performance, health, and usage of applications running in cloud, hybrid, and on-premises environments.Key features of New Relic include:Application monitoring -...

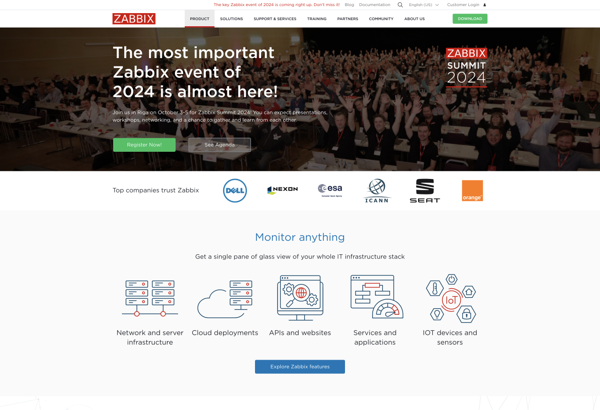
Zabbix
Zabbix is an enterprise-class open source distributed monitoring solution for networks and applications. It is designed to monitor and track the status of various network services, servers, and other network hardware. It provides real-time graphing, alerting, visualization and reporting for monitoring IT infrastructure performance and availability.Some of the key features...
Nagios
Nagios is an open source computer system and network monitoring software application. It watches hosts and services, sends notifications when things go wrong, and alerts users when issues come up. Nagios helps system administrators detect and resolve IT infrastructure problems before they affect critical business processes.Some key capabilities of Nagios...

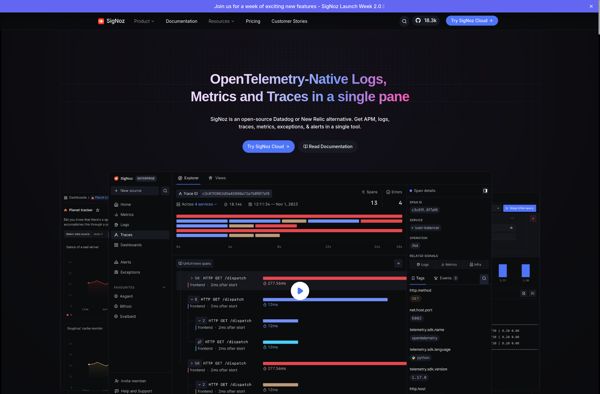
SigNoz
SigNoz is an open-source alternative to commercial Application Performance Monitoring (APM) tools like DataDog, New Relic, and Dynatrace. It is a cloud-native observability platform designed specifically for monitoring modern distributed systems.Some key capabilities and benefits of SigNoz include:Lightweight and optimized for microservices, serverless, and Kubernetes environmentsCollects metrics, traces, and logs...