SigNoz vs pgDash

Struggling to choose between SigNoz and pgDash? Both products offer unique advantages, making it a tough decision.

SigNoz is a Ai Tools & Services solution with tags like observability, monitoring, metrics, tracing, logs, opensource.

It boasts features such as Distributed tracing, Metrics monitoring, Log management, Alerting, Anomaly detection, Service maps, Customizable dashboards and pros including Open source and free, Easy to install and configure, Good documentation, Integrates with popular tools like Prometheus, Scalable and cloud native.

On the other hand, pgDash is a Development product tagged with dashboard, insights, postgresql, performance.

Its standout features include Real-time dashboard for monitoring PostgreSQL databases, Visualizations for key metrics like CPU usage, memory usage, query throughput, etc., Query stats to identify slow, frequent, and expensive queries, Database health checks and diagnostics, Connection and configuration info, Works with PostgreSQL 9.3 and above, and it shines with pros like Open source and free to use, Easy to set up and configure, Good for monitoring overall database health, Helpful for optimizing queries and database performance, Web-based so can access from anywhere.

To help you make an informed decision, we've compiled a comprehensive comparison of these two products, delving into their features, pros, cons, pricing, and more. Get ready to explore the nuances that set them apart and determine which one is the perfect fit for your requirements.

SigNoz

SigNoz

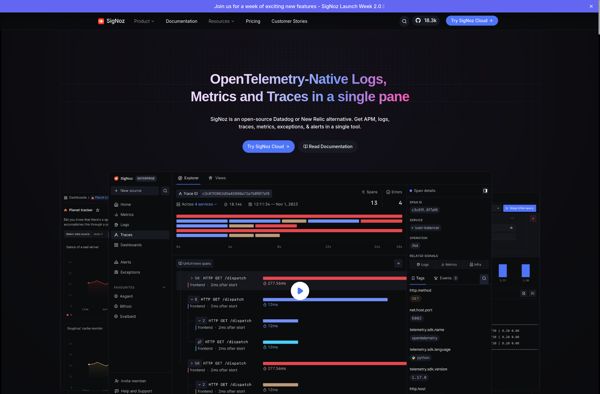
SigNoz is an open-source alternative to DataDog, New Relic, and other APM tools. It is a cloud-native observability platform that provides metrics, traces, and logs to monitor software applications and infrastructure.

Categories:
observability monitoring metrics tracing logs opensource

SigNoz Features

  1. Distributed tracing
  2. Metrics monitoring
  3. Log management
  4. Alerting
  5. Anomaly detection
  6. Service maps
  7. Customizable dashboards

Pricing

  • Open Source
  • Freemium

Pros

Open source and free

Easy to install and configure

Good documentation

Integrates with popular tools like Prometheus

Scalable and cloud native

Cons

Limited built-in anomaly detection

Less out-of-box integrations than commercial tools

Lacks some advanced features like AIOps


pgDash

pgDash

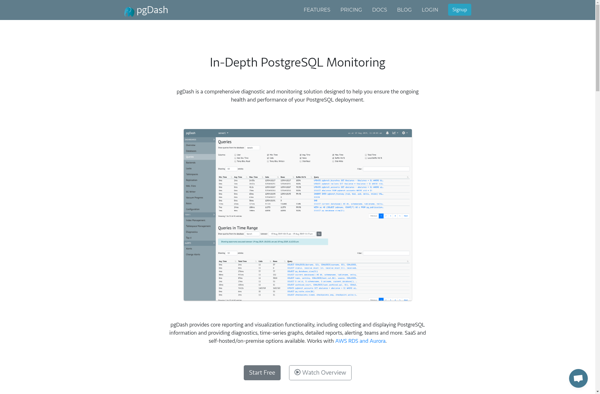
pgDash is an open-source web-based dashboard and insights tool for PostgreSQL databases. It provides visualizations, metrics, and query stats to help developers and DBAs monitor and optimize PostgreSQL performance.

Categories:
dashboard insights postgresql performance

PgDash Features

  1. Real-time dashboard for monitoring PostgreSQL databases
  2. Visualizations for key metrics like CPU usage, memory usage, query throughput, etc.
  3. Query stats to identify slow, frequent, and expensive queries
  4. Database health checks and diagnostics
  5. Connection and configuration info
  6. Works with PostgreSQL 9.3 and above

Pricing

  • Open Source

Pros

Open source and free to use

Easy to set up and configure

Good for monitoring overall database health

Helpful for optimizing queries and database performance

Web-based so can access from anywhere

Cons

Limited historical data and stats

Not as full-featured as paid alternatives

Requires some knowledge of PostgreSQL to get most value

Only works with PostgreSQL databases