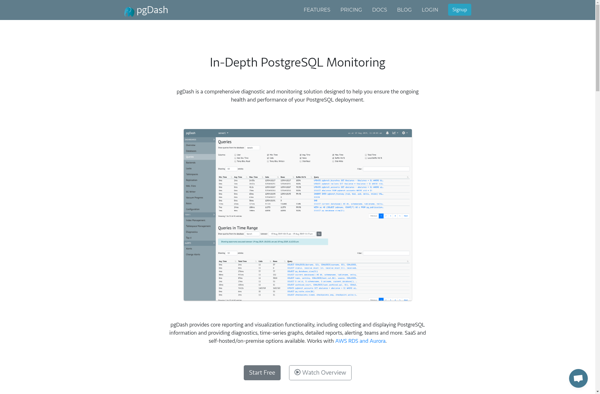
pgDash
Description: pgDash is an open-source web-based dashboard and insights tool for PostgreSQL databases. It provides visualizations, metrics, and query stats to help developers and DBAs monitor and optimize PostgreSQL performance.
Type: software
Pricing: Open Source
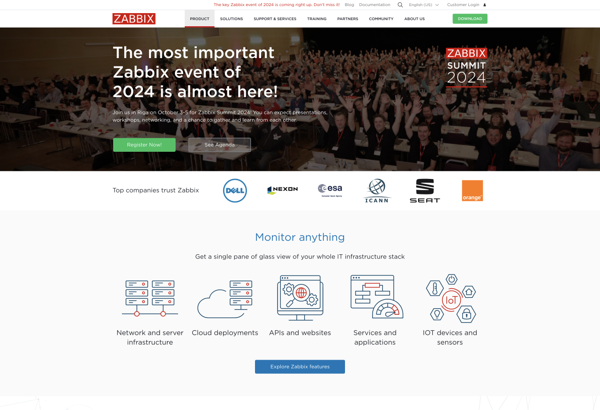
Zabbix
Description: Zabbix is an open source network and application monitoring software. It helps monitor servers, networks, cloud resources, and services by collecting metrics via agents, APIs, or SNMP. It offers real-time graphs, alerts, reporting, and automated actions.
Type: software
Pricing: Free