VividCortex vs New Relic

Struggling to choose between VividCortex and New Relic? Both products offer unique advantages, making it a tough decision.

VividCortex is a Ai Tools & Services solution with tags like monitoring, analytics, database, mysql, postgresql, mongodb, redis.

It boasts features such as Real-time database monitoring and analytics, Query performance insights, Workload visualization and analysis, Alerts for slow queries and performance issues, Historical performance trending, Custom dashboards and pros including Detailed visibility into database workload and performance, Identify slow queries and bottlenecks, Track database trends over time, Customizable dashboards and alerts, Works with major databases like MySQL, PostgreSQL, MongoDB, Cloud-based SaaS model for easy setup.

On the other hand, New Relic is a Ai Tools & Services product tagged with monitoring, performance, analytics, application, devops.

Its standout features include Real-time performance monitoring, Error and exception tracking, Transaction tracing, Cross-application tracing, Alerting and notifications, Custom dashboards, Log management, Browser monitoring, Mobile monitoring, and it shines with pros like Detailed performance insights, Quick and easy setup, Flexible alerting, Integration with many platforms, Good customer support.

To help you make an informed decision, we've compiled a comprehensive comparison of these two products, delving into their features, pros, cons, pricing, and more. Get ready to explore the nuances that set them apart and determine which one is the perfect fit for your requirements.

VividCortex

VividCortex

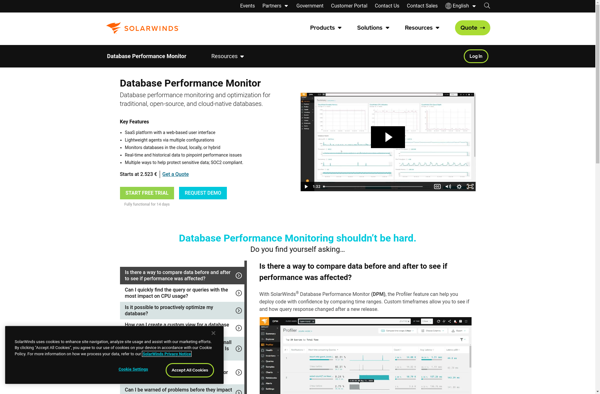
VividCortex is a database monitoring and analytics platform designed specifically for MySQL, PostgreSQL, MongoDB, Redis, and other databases. It provides deep visibility into database workload, queries, performance issues, and trends.

Categories:
monitoring analytics database mysql postgresql mongodb redis

VividCortex Features

  1. Real-time database monitoring and analytics
  2. Query performance insights
  3. Workload visualization and analysis
  4. Alerts for slow queries and performance issues
  5. Historical performance trending
  6. Custom dashboards

Pricing

  • Subscription-Based

Pros

Detailed visibility into database workload and performance

Identify slow queries and bottlenecks

Track database trends over time

Customizable dashboards and alerts

Works with major databases like MySQL, PostgreSQL, MongoDB

Cloud-based SaaS model for easy setup

Cons

Can get expensive for large or complex environments

Limited support for less common databases

May require additional overhead for full functionality

Not designed for real-time debugging


New Relic

New Relic

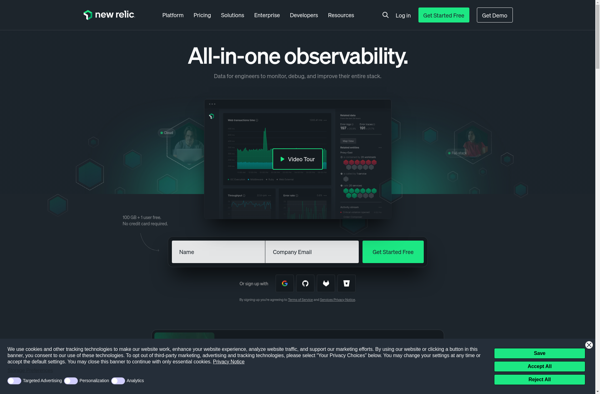
New Relic is a performance monitoring software for applications. It allows developers to track and monitor application performance in real-time to detect and diagnose issues. New Relic provides insights into app load times, throughput, errors, and more.

Categories:
monitoring performance analytics application devops

New Relic Features

  1. Real-time performance monitoring
  2. Error and exception tracking
  3. Transaction tracing
  4. Cross-application tracing
  5. Alerting and notifications
  6. Custom dashboards
  7. Log management
  8. Browser monitoring
  9. Mobile monitoring

Pricing

  • Free
  • Subscription-Based

Pros

Detailed performance insights

Quick and easy setup

Flexible alerting

Integration with many platforms

Good customer support

Cons

Can get expensive for large apps

Steep learning curve

May need additional services for full APM

Alerts can be noisy if not tuned