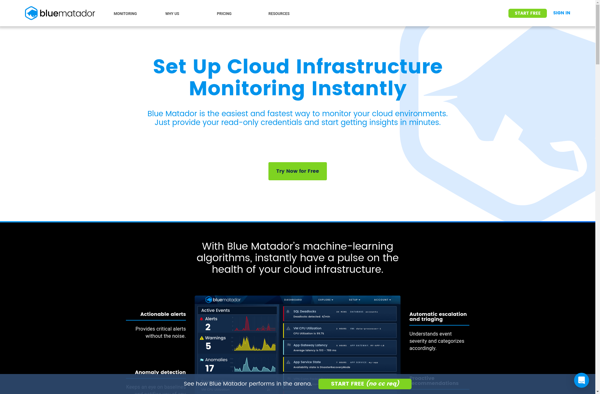
Blue Matador is a cloud-based monitoring and observability platform designed for infrastructure and application performance monitoring. It provides real-time alerts, log analysis, incident investigation tools, and integration with popular DevOps tools.
Blue Matador: Cloud-Based Monitoring and Observability Platform
A cloud-based monitoring and observability platform for infrastructure and application performance monitoring, providing real-time alerts, log analysis, incident investigation tools, and integration with popular DevOps tools.
What is Blue Matador?
Blue Matador is a cloud-native monitoring and observability platform optimized for modern infrastructure and applications. It provides real-time monitoring, alerting, log analysis, incident investigation, and integration with popular DevOps tools and services.
Key features of Blue Matador include:
Automatic discovery of infrastructure, containers, services, and applications
Out-of-the-box monitoring for common technologies like Kubernetes, AWS, databases, web servers, etc.
Customizable alerts and thresholds based on metrics, logs, and synthetic tests
Incident investigation with topology maps, metrics, and logs in one place
Powerful log analysis and visualization
Integration with Slack, PagerDuty, ServiceNow and other tools
Agentless monitoring with support for common data formats
Role-based access control and audit logging for security
Blue Matador is designed to provide full-stack observability for cloud-native and traditional applications with minimal configuration. Its automated discovery and monitoring make it easy to gain visibility and stay on top of issues before they cause downtime.
Blue Matador Features
Features
Real-time alerting and anomaly detection
Log analysis and aggregation
Incident investigation with topology maps
Integration with DevOps tools like Datadog, PagerDuty, Slack
Datadog is a SaaS-based monitoring and analytics platform for cloud applications. It provides complete visibility into dynamic infrastructures by aggregating metrics, events, and logs from servers, containers, databases, tools, and services. This allows Dev and Ops teams to quickly solve performance problems, prove the root cause of software bugs, spot...
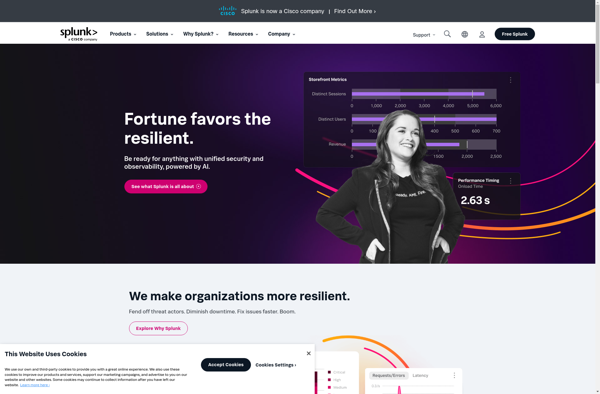
Splunk is a software platform that enables users to search, analyze, and visualize the data gathered from the infrastructure, systems, and applications of an organization. It captures, indexes, and correlates real-time data in a searchable repository from which it can generate graphs, reports, alerts, dashboards, and visualizations.Some key features and...
New Relic is a comprehensive application performance monitoring and observability platform used by software engineers to monitor, troubleshoot, and optimize their applications and infrastructure. It provides real-time visibility into the performance, health, and usage of applications running in cloud, hybrid, and on-premises environments.Key features of New Relic include:Application monitoring -...
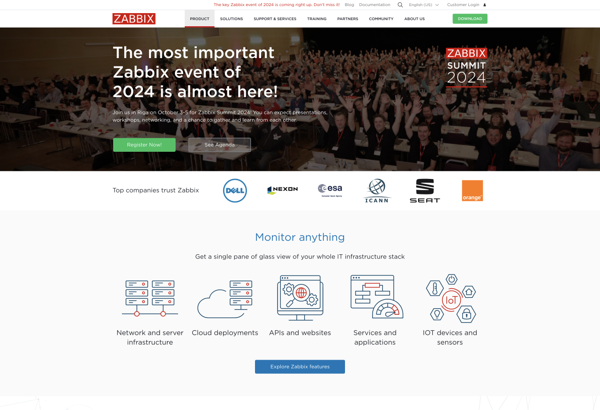
Zabbix is an enterprise-class open source distributed monitoring solution for networks and applications. It is designed to monitor and track the status of various network services, servers, and other network hardware. It provides real-time graphing, alerting, visualization and reporting for monitoring IT infrastructure performance and availability.Some of the key features...
Nagios is an open source computer system and network monitoring software application. It watches hosts and services, sends notifications when things go wrong, and alerts users when issues come up. Nagios helps system administrators detect and resolve IT infrastructure problems before they affect critical business processes.Some key capabilities of Nagios...
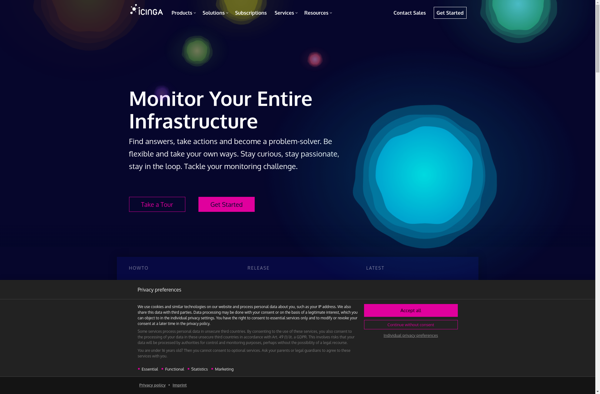
Icinga is an open source monitoring system which checks the availability of your network resources, notifies users of outages, and generates performance data for reporting. It is a fork of the popular Nagios monitoring system and aims to improve upon some of its shortcomings.Some key features of Icinga include:Monitoring of...
Monitis is a cloud-based IT infrastructure monitoring and management platform designed for businesses and IT teams. It provides a single dashboard to monitor the uptime, performance, and health of servers, applications, networks, websites, and other IT infrastructure components.Key features of Monitis include:Uptime and synthetic monitoring to track availability and response...
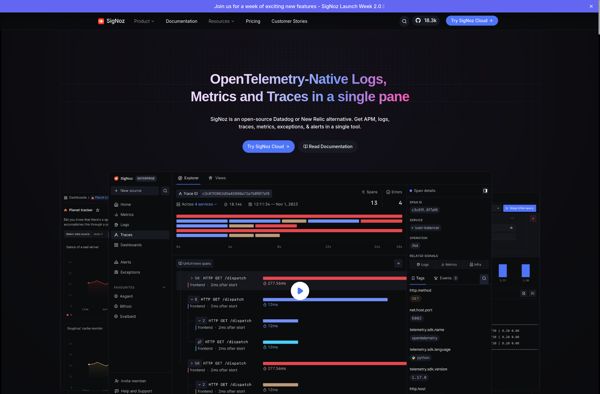
SigNoz is an open-source alternative to commercial Application Performance Monitoring (APM) tools like DataDog, New Relic, and Dynatrace. It is a cloud-native observability platform designed specifically for monitoring modern distributed systems.Some key capabilities and benefits of SigNoz include:Lightweight and optimized for microservices, serverless, and Kubernetes environmentsCollects metrics, traces, and logs...