Struggling to choose between Sentinet3 and Ganglia? Both products offer unique advantages, making it a tough decision.
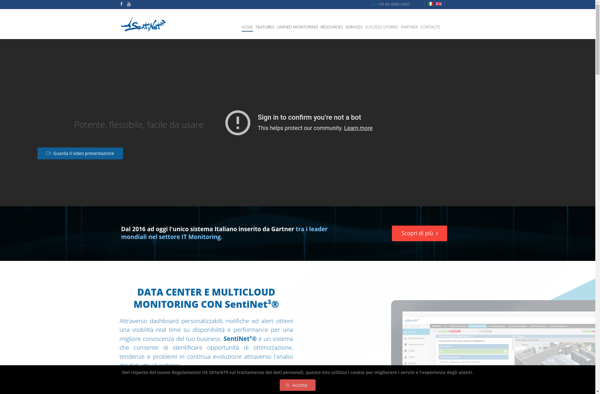
Sentinet3 is a Network & Admin solution with tags like monitoring, analytics, discovery, topology, bandwidth, alerting, reporting.
It boasts features such as Automated network discovery and mapping, Real-time network monitoring and analytics, Anomaly and threat detection, Customizable dashboards and reporting, Event log management, Configuration management, Capacity forecasting and planning and pros including Comprehensive visibility into network performance and health, Powerful analytics and automation capabilities, Flexible and customizable monitoring, Scales to monitor large, complex networks, Easy to deploy and use.
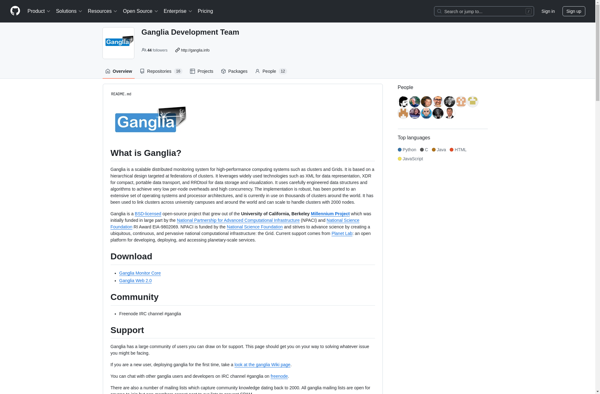
On the other hand, Ganglia is a Network & Admin product tagged with monitoring, metrics, utilization, bottlenecks, faults, distributed-systems.
Its standout features include Real-time monitoring of clusters and grids, Collection of metrics like CPU usage, memory usage, network traffic, Visualization of metrics through web interface, Alerting based on thresholds, Support for heterogeneous clusters with different architectures, Scalable to clusters with thousands of nodes, and it shines with pros like Open source and free, Easy to set up and configure, Low overhead, Web interface for easy access to metrics, Extensible and customizable using plugins, Widely used and supported.
To help you make an informed decision, we've compiled a comprehensive comparison of these two products, delving into their features, pros, cons, pricing, and more. Get ready to explore the nuances that set them apart and determine which one is the perfect fit for your requirements.
Sentinet3 is a network monitoring and analytics platform designed to provide visibility into network data. It features automated discovery of devices, network topology mapping, bandwidth monitoring, alerting, and reporting.
Ganglia is an open-source monitoring system for high-performance computing systems such as clusters and grids. It collects and visualizes various metrics like CPU utilization, memory usage, network traffic etc. in real-time. It allows for easy identification of bottlenecks and faults in distributed systems.