Startegy is a business strategy and management software that helps companies set objectives, create strategic plans, and track performance. It provides tools for SWOT analysis, PEST analysis, risk analysis, competitor analysis, and more to inform smart strategy decisions.
Startegy helps companies set objectives, create strategic plans, and track performance. It provides tools for SWOT analysis, PEST analysis, risk analysis, competitor analysis, and more to inform smart strategy decisions.
What is Startegy?
Startegy is a comprehensive business strategy software designed to help organizations develop, execute, and manage their strategic plans effectively. It provides a centralized workspace for strategic planning and performance management.
Key features of Startegy include:
Objectives Management - Set organizational objectives, link them to overarching strategy, assign owners, and track progress
Strategy Mapping - Visualize strategies and strategic themes on an interactive map to align initiatives
SWOT Analysis - Identify strengths, weaknesses, opportunities and threats to inform strategic decision-making
PEST Analysis - Understand political, economic, social and technological factors impacting your business
Risk Analysis - Identify and assess potential risks to your strategy and performance
Competitor Analysis - Research, analyze and benchmark against competitors
Performance Tracking - Track KPIs and progress towards objectives
Reporting & Analytics - Generate reports and visualizations to share insights and progress
With powerful tools for strategic planning and execution management, Startegy enables organizations to adapt quickly to changing market conditions and outperform competitors.
Microsoft Power BI is a powerful business analytics service developed by Microsoft. It empowers users to transform raw data into meaningful insights, create interactive reports and dashboards, and share data-driven stories within an organization. Power BI is designed to help businesses and individuals make informed decisions based on a comprehensive...
iot-dashboard is an open-source Internet of Things (IoT) data visualization and monitoring web application. It provides an intuitive graphical interface that allows users to easily create customizable dashboards to visualize and monitor data from IoT devices, sensors, and other data sources in real-time.Some key features of iot-dashboard include:Support for connecting...
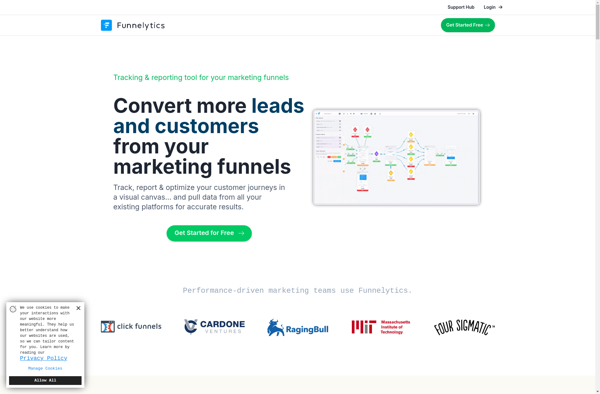
Funnelytics is a comprehensive marketing analytics platform designed to help businesses visualize and optimize their conversion funnels and customer journeys. It integrates data from multiple sources like websites, ads, CRM systems, etc. to create a single customer view.Key features of Funnelytics include:Interactive conversion funnel analysis to identify sticking points and...
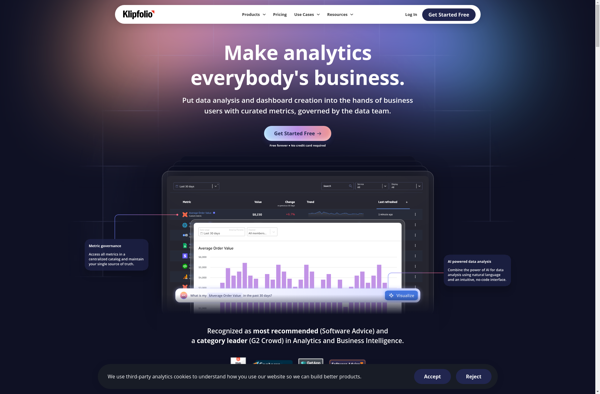
Klipfolio PowerMetrics is a flexible, cloud-based business intelligence and data visualization platform designed to help businesses gain insights from their data. Some key features include:Customizable dashboards - Users can build interactive dashboards with charts, graphs, tables, images and more to visualize key data.Real-time data connectivity - Connect to cloud apps,...
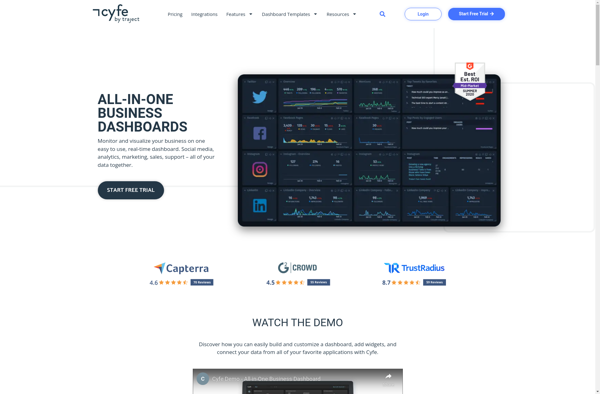
Cyfe is a powerful yet easy-to-use business dashboard and data visualization platform designed to help companies track, analyze, and visualize key performance indicators from all areas of their business. As an all-in-one solution, Cyfe eliminates the need to login to multiple accounts by integrating directly with popular business apps and...
Cyclotron is an open-source task management and productivity application for Windows, macOS, and Linux operating systems. It provides users with a flexible framework to organize individual tasks as well as larger projects.Key features of Cyclotron include:Custom categories, tags, milestones, and workflows to categorize tasks and structure projectsCalendar and reminder system...
Freeboard is an open-source business intelligence and data visualization software. It provides an intuitive drag-and-drop interface that allows users to visualize data from multiple sources, without needing to code. Some key features of Freeboard include:Connectivity to a variety of data sources like SQL databases, REST APIs, MQTT, and moreLibrary of...
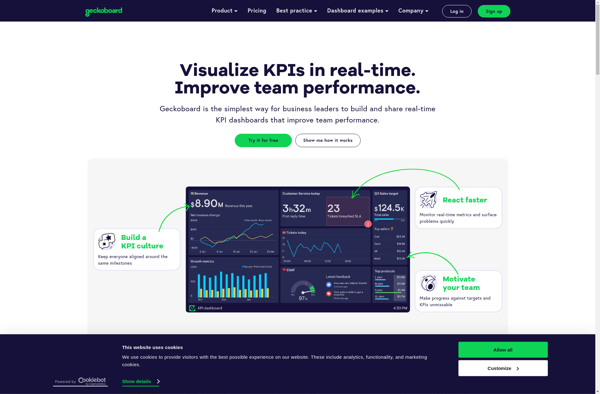
Geckoboard is a cloud-based business intelligence and data visualization platform used by over 30,000 companies worldwide. It allows users to build interactive TV dashboards that bring together data from various sources, both within a company and from external applications, to provide real-time visibility into critical metrics.Geckoboard integrates with 100+ data...
SumAll is a cloud-based social media analytics platform designed to help marketers and businesses aggregate and analyze data from multiple social media channels. It pulls metrics from popular platforms like Facebook, Twitter, Instagram, YouTube, and LinkedIn into one centralized dashboard to give users a holistic view of their social media...
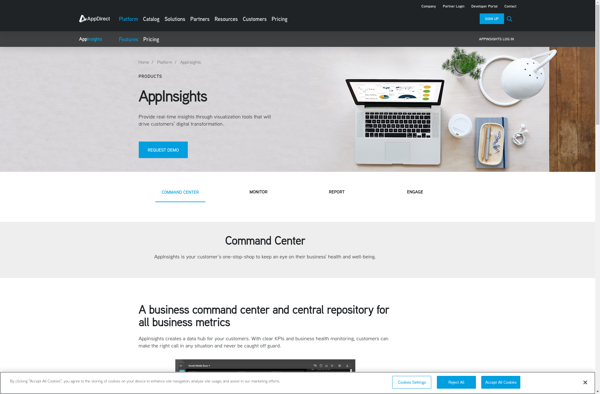
AppInsights is an extensive application performance management (APM) service provided by Microsoft Azure. It allows developers to easily monitor their live web applications and track key metrics like response time, failure rates, dependency rates, and more. Some key capabilities of AppInsights:Monitor response time, failure rates, exceptions to identify performance issues...
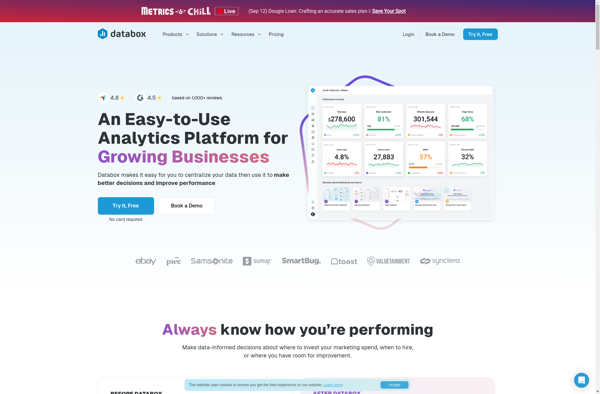
Databox is an open-source personal data platform that enables individuals to manage their personal data securely and privately. Developed by researchers at Imperial College London and the University of Cambridge, Databox allows users to connect data sources like smartphones, wearables, and web apps to feed data into the platform.Once data...
Whatagraph is a robust yet easy-to-use data visualization and reporting platform suitable for business users of all backgrounds. With an intuitive drag-and-drop interface, anyone can create interactive dashboards, charts, maps, and graphs that automatically update when data changes.Whatagraph connects directly to data sources like MySQL, PostgreSQL, Excel, Google Sheets, and...