iot-dashboard is an open-source Internet of Things (IoT) data visualization and monitoring tool. It allows users to easily create customizable dashboards to visualize and monitor data from IoT devices and sensors in real-time.
An open-source Internet of Things (IoT) data visualization and monitoring tool for creating customizable dashboards to visualize and monitor data from IoT devices and sensors in real-time.
What is Iot-dashboard?
iot-dashboard is an open-source Internet of Things (IoT) data visualization and monitoring web application. It provides an intuitive graphical interface that allows users to easily create customizable dashboards to visualize and monitor data from IoT devices, sensors, and other data sources in real-time.
Some key features of iot-dashboard include:
Support for connecting to various data sources such as MQTT brokers, REST APIs, databases, and more
Drag-and-drop dashboard designer to create customized layouts
Various built-in widget types such as charts, gauges, maps, tables, and more for data visualization
Responsive layouts that adapt to mobile, tablet, and desktop screens
User management, access controls, and data access policies
Annotations and reporting capabilities
Open source under the MIT license with an active developer community
iot-dashboard enables faster IoT application development by providing pre-built components to visualize, monitor, and alert on data feeds. It can be used for monitoring applications in smart homes, smart factories, smart farming, healthcare, smart cities, and more. The open-source nature also allows custom plugins and widgets to be developed for specific use cases.
Iot-dashboard Features
Features
Real-time data visualization
Customizable dashboards
Support for various data sources like MQTT, REST API, Websockets
Drag and drop interface for building dashboards
Variety of widgets like charts, gauges, maps, buttons, etc
Role based access control
Alerting and notifications
Pricing
Open Source
Pros
Open source and free to use
Easy to set up and use
Very customizable and extensible
Active community support
Cons
Limited built-in analytics capabilities
Can be resource intensive for large scale deployments
Requires technical expertise to fully utilize features
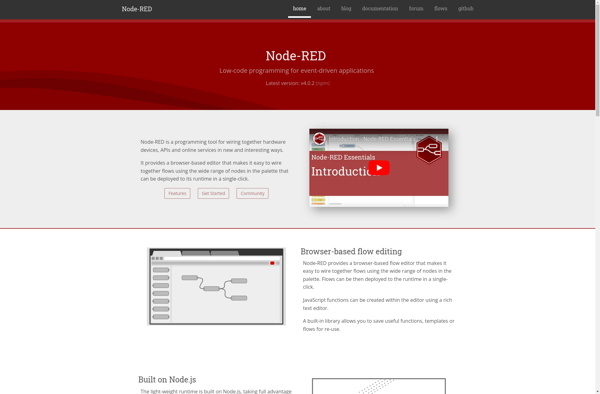
Node-RED is an open-source visual programming tool built on Node.js for wiring together hardware devices, APIs, and online services. It provides a browser-based flow editor that makes it easy to wire together flows using a wide range of nodes that can be deployed to its runtime in a single click.Some...
SiteWhere.io is an open-source Internet of Things (IoT) application enablement platform designed specifically for industrial IoT and location tracking use cases. It provides capabilities for real-time location processing, data management and analytics focused on spatial/location-based data from industrial assets.Some key capabilities and features of SiteWhere.io include:Ability to connect IoT devices...
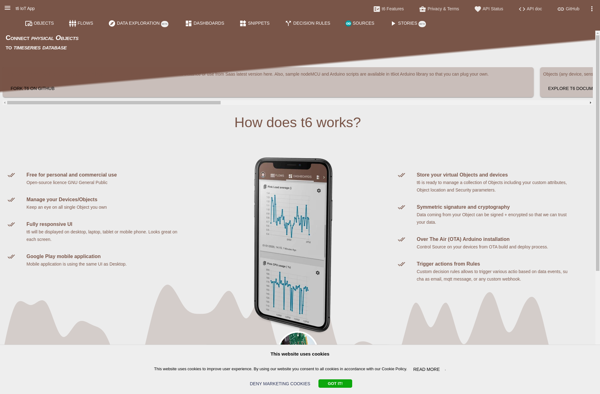
t6 IoT is an end-to-end Internet of Things (IoT) platform designed to help enterprises and organizations connect, manage, and gain insights from network-connected devices and sensors. Some key capabilities and features of t6 IoT include:Device connectivity and management - t6 IoT provides connectors to simplify connecting and managing diverse IoT...
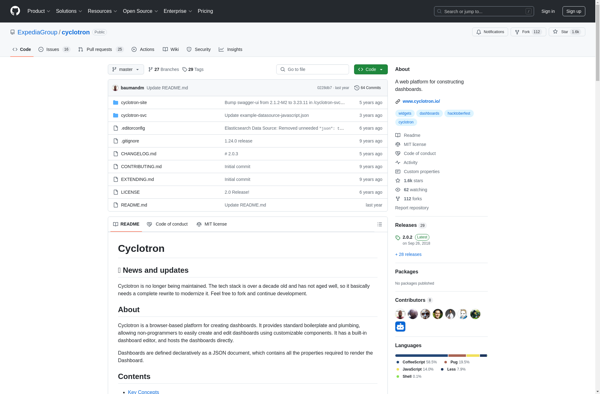
Cyclotron is an open-source task management and productivity application for Windows, macOS, and Linux operating systems. It provides users with a flexible framework to organize individual tasks as well as larger projects.Key features of Cyclotron include:Custom categories, tags, milestones, and workflows to categorize tasks and structure projectsCalendar and reminder system...
Freeboard is an open-source business intelligence and data visualization software. It provides an intuitive drag-and-drop interface that allows users to visualize data from multiple sources, without needing to code. Some key features of Freeboard include:Connectivity to a variety of data sources like SQL databases, REST APIs, MQTT, and moreLibrary of...
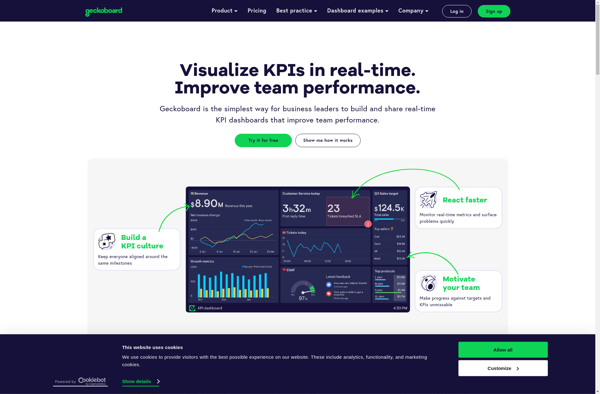
Geckoboard is a cloud-based business intelligence and data visualization platform used by over 30,000 companies worldwide. It allows users to build interactive TV dashboards that bring together data from various sources, both within a company and from external applications, to provide real-time visibility into critical metrics.Geckoboard integrates with 100+ data...
Corezoid is a low-code process automation and integration platform designed to help organizations improve operational efficiency. It provides a visual interface to model complex business processes that connect enterprise applications, data sources, APIs and more.Some key capabilities and benefits of Corezoid include:Drag-and-drop workflow designer to visually map out processes without...
DashThis is a user-friendly project management and task tracking application designed for small teams and businesses. It provides an intuitive interface to plan projects, create tasks, set due dates, assign work to team members, track progress, and collaborate with others.Some key features of DashThis include:Flexible project views - See all...
ioBroker is an open source home automation platform designed to integrate various smart home systems and technologies into one centralized system for control and automation. Here is an overview of key details about ioBroker:It can connect to and control devices using standards and protocols like Z-Wave, Philips Hue, MQTT, HTTP...
Corlysis is an open-source, cross-platform alternative to Minitab Statistical Software. It is a desktop application available for Windows, Mac, and Linux operating systems that provides extensive capabilities for statistical analysis and data visualization.With Corlysis, users can import data from a variety of sources including CSV files, databases, and other statistical...
Screenful is a feature-rich screen recorder and screenshot tool available for Windows, Mac and Chromebook. It makes capturing, editing and sharing screenshots and recordings simple.With Screenful you can record your full screen, specific regions, webcam, computer audio, and annotate/draw over your recordings. It has built-in editing tools to crop, trim...
Startegy is a comprehensive business strategy software designed to help organizations develop, execute, and manage their strategic plans effectively. It provides a centralized workspace for strategic planning and performance management.Key features of Startegy include:Objectives Management - Set organizational objectives, link them to overarching strategy, assign owners, and track progressStrategy Mapping...
Everview is a visual collaboration software designed to simplify the design review and feedback process for teams. It provides a single online space to upload, discuss, and iterate on any visual content, including design files, documents, websites, presentations, and more.Some key features of Everview include:Real-time commenting and annotation tools for...
HappyMetrix Dashboards is a flexible business intelligence and data visualization solution designed to help companies gain insights from their data. It allows users without technical expertise to easily connect multiple data sources, create interactive dashboards and data visualizations, and share insights across the organization.Some key features of HappyMetrix Dashboards include:Drag-and-drop...