HappyMetrix Dashboards

HappyMetrix Dashboards

HappyMetrix Dashboards is a data visualization and business intelligence software that allows users to create interactive dashboards to track KPIs. It connects to various data sources and has drag-and-drop functionality to build charts, graphs, and gauges quickly.
HappyMetrix Dashboards image
data-visualization dashboard kpi-tracking charts business-intelligence

HappyMetrix Dashboards: Data Visualization & Business Intelligence Software

HappyMetrix Dashboards is a data visualization and business intelligence software that allows users to create interactive dashboards to track KPIs. It connects to various data sources and has drag-and-drop functionality to build charts, graphs, and gauges quickly.

What is HappyMetrix Dashboards?

HappyMetrix Dashboards is a flexible business intelligence and data visualization solution designed to help companies gain insights from their data. It allows users without technical expertise to easily connect multiple data sources, create interactive dashboards and data visualizations, and share insights across the organization.

Some key features of HappyMetrix Dashboards include:

  • Drag-and-drop interface to quickly build dashboards with advanced charts, tables, gauges and graphs
  • Library of customizable widgets and visualizations
  • Connectors to integrate data from SQL, NoSQL databases, cloud apps, etc.
  • Real-time data connectivity to see up-to-date metrics
  • Interactive features like filters, drilldowns andParameters to customize analysis
  • Automated alert system to set threshold-based alerts
  • Role-based access controls for managing users and permissions
  • Options to schedule and distribute reports to stakeholders
  • APIs and integrations with BI tools like Tableau, Power BI, etc.

With an intuitive interface and broad data connectivity, HappyMetrix Dashboards enables companies to democratize data analytics across teams and make more informed, data-driven decisions.

HappyMetrix Dashboards Features

Features

  1. Drag-and-drop interface to build dashboards
  2. Connects to various data sources like SQL, MongoDB, REST APIs
  3. Library of customizable widgets like charts, graphs, gauges
  4. Real-time data updates
  5. Collaboration tools to share and discuss dashboards
  6. Access control and user management
  7. Scheduled and automated reporting

Pricing

  • Freemium
  • Subscription-Based

Pros

Intuitive and easy to use

Great for visualizing business metrics and KPIs

Scales to large data sets

Good support for customization and extensibility

Decent pricing for small and mid-sized businesses

Cons

Steep learning curve for advanced features

Limited forecasting and predictive analytics

Can be expensive for larger enterprises

Lacks some complex visualization options


The Best HappyMetrix Dashboards Alternatives

Top Business & Commerce and Business Intelligence & Analytics and other similar apps like HappyMetrix Dashboards


Iot-dashboard icon

Iot-dashboard

iot-dashboard is an open-source Internet of Things (IoT) data visualization and monitoring web application. It provides an intuitive graphical interface that allows users to easily create customizable dashboards to visualize and monitor data from IoT devices, sensors, and other data sources in real-time.Some key features of iot-dashboard include:Support for connecting...
Cyclotron icon

Cyclotron

Cyclotron is an open-source task management and productivity application for Windows, macOS, and Linux operating systems. It provides users with a flexible framework to organize individual tasks as well as larger projects.Key features of Cyclotron include:Custom categories, tags, milestones, and workflows to categorize tasks and structure projectsCalendar and reminder system...
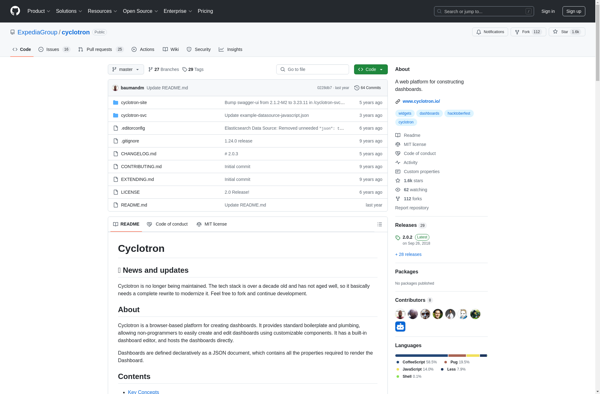
Cyclotron image
JSlate icon

JSlate

jSlate is an open-source vector graphics and diagramming web application for creating a wide variety of diagrams and sketches. With its intuitive drag-and-drop interface, jSlate makes it easy for users to construct flowcharts, UML diagrams, user interface mockups, network diagrams, organizational charts, and more.Some key features of jSlate include:Drag-and-drop shapes...
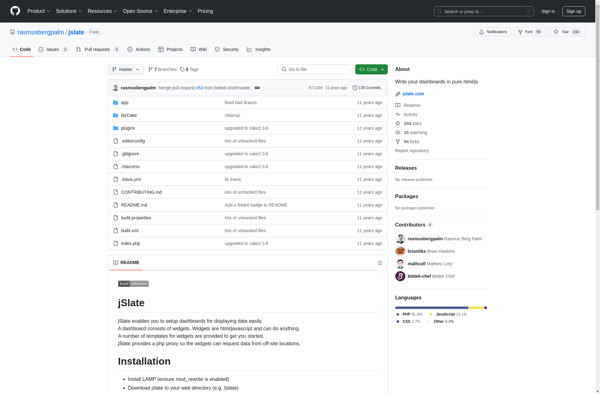
JSlate image
Dashing icon

Dashing

Dashing is an open-source web application dashboard framework that allows developers and non-developers alike to build beautiful, real-time dashboards. It provides a simple way to organize and monitor complex data, making it easy to visualize and share key metrics and insights.Dashing is built on top of the Sinatra web framework...
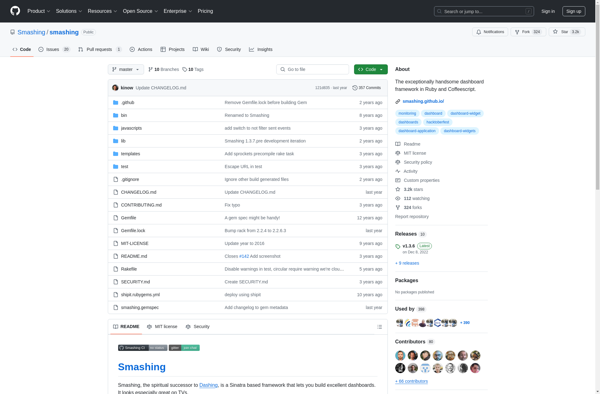
Dashing image
Web Control Room icon

Web Control Room

Web Control Room is a powerful yet easy-to-use web analytics platform designed for small to medium businesses. It gives comprehensive insights into website visitors and traffic sources along with tools to identify qualified leads and optimize conversion funnels.With Web Control Room, businesses can:Track visitors and pageviews to understand website usage...
Web Control Room image
Mantle Enterprise Analytics icon

Mantle Enterprise Analytics

Mantle Enterprise Analytics is a robust business intelligence and analytics solution catered towards large enterprises. It provides a wide range of capabilities to collect, store, process, analyze, and visualize data across the organization.Key features include:Interactive dashboards and reports for data visualizationPredictive modeling, forecasting, and machine learning algorithmsConnectors to extract data...
Mantle Enterprise Analytics image
Fruit Dashboard icon

Fruit Dashboard

Fruit Dashboard is a powerful, easy-to-use business intelligence and data visualization platform built specifically for the fruit industry. Companies of any size can use Fruit Dashboard to connect data from multiple sources, build interactive dashboards and reports, set metrics and KPIs, and gain valuable insights.With drag-and-drop simplicity, Fruit Dashboard makes...
FinalBoard icon

FinalBoard

FinalBoard is a flexible project management software designed for agile teams. It provides tools to plan projects, break down work into manageable tasks, track progress, and collaborate across teams.Key features of FinalBoard include:Interactive kanban boards to visualize work and track progressCustomizable workflows and automation to match any processFlexible task and...
FinalBoard image
Informly icon

Informly

Informly is a robust customer feedback and product reviews software designed to help companies better understand and act on customer opinions. It includes the following key features:NPS Surveys - Send customized Net Promoter Score surveys via email and SMS to measure customer loyalty.In-App Surveys - Embed feedback forms directly into...
Informly image