Ducksboard is a business intelligence and data visualization software that allows users to create real-time dashboards to monitor key metrics. It integrates with various data sources and uses drag-and-drop widgets to build customizable dashboards.
Business intelligence and data visualization software for real-time dashboard creation, with integration and drag-and-drop widget functionality
What is Ducksboard?
Ducksboard is a cloud-based business intelligence and data visualization platform used by companies to monitor key performance indicators and other metrics in real-time. It allows users to create customizable dashboards using a drag-and-drop interface and various widget types like charts, graphs, gauges, tables, and more.
Some key features of Ducksboard include:
Real-time dashboard updates with data from various sources like databases, web apps, cloud services, etc.
Library of pre-built integrations and widgets to accelerate dashboard creation
Flexible API to connect any data source or to extract data
Customizable widgets and dashboard layouts for different user needs
Visual alerts and notifications when metrics cross defined thresholds
User management, sharing and permissions on dashboards
Mobile apps to view dashboards on-the-go
Ducksboard is useful for various departments in an organization like marketing, sales, support, engineering, and more to track essential metrics and KPIs. Its visual interface makes it easy to instantly analyze current data and trends to take informed decisions. With its focus on real-time data and ease of building dashboards, Ducksboard serves as an effective business intelligence tool.
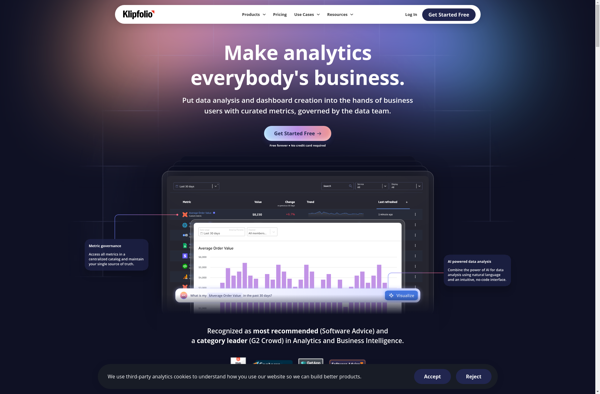
Klipfolio PowerMetrics is a flexible, cloud-based business intelligence and data visualization platform designed to help businesses gain insights from their data. Some key features include:Customizable dashboards - Users can build interactive dashboards with charts, graphs, tables, images and more to visualize key data.Real-time data connectivity - Connect to cloud apps,...
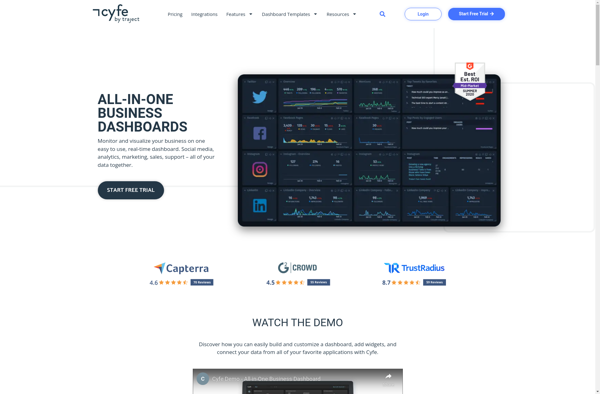
Cyfe is a powerful yet easy-to-use business dashboard and data visualization platform designed to help companies track, analyze, and visualize key performance indicators from all areas of their business. As an all-in-one solution, Cyfe eliminates the need to login to multiple accounts by integrating directly with popular business apps and...
Freeboard is an open-source business intelligence and data visualization software. It provides an intuitive drag-and-drop interface that allows users to visualize data from multiple sources, without needing to code. Some key features of Freeboard include:Connectivity to a variety of data sources like SQL databases, REST APIs, MQTT, and moreLibrary of...
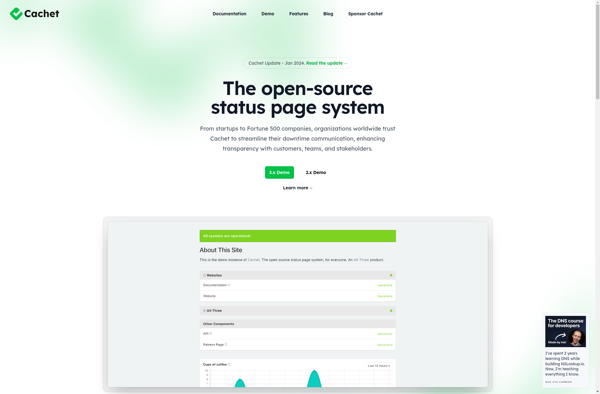
Cachet is an open source status page system that allows users to create elegant status and incident report pages to communicate issues with websites, applications, networks, or services. It provides a dashboard for administrators to quickly update the status page and push notifications to subscribed users.Some key features of Cachet...
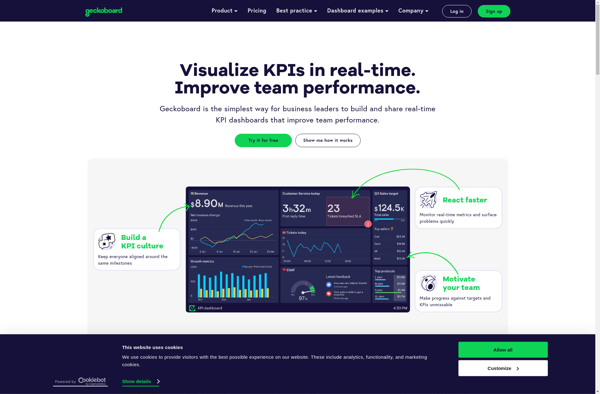
Geckoboard is a cloud-based business intelligence and data visualization platform used by over 30,000 companies worldwide. It allows users to build interactive TV dashboards that bring together data from various sources, both within a company and from external applications, to provide real-time visibility into critical metrics.Geckoboard integrates with 100+ data...
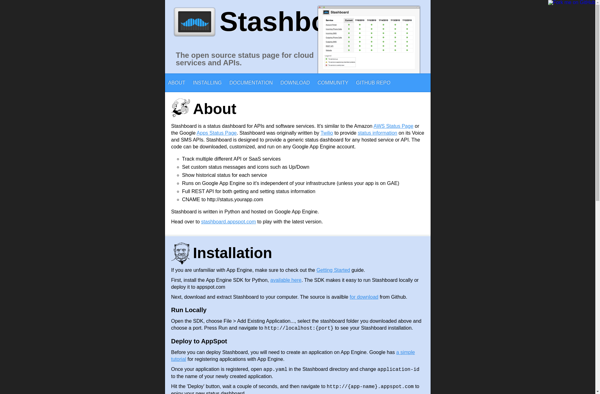
Stashboard is an open-source status dashboard application written in Python using the Django web framework. It is designed to be lightweight, customizable and easy to set up to display the status of various services on a simple web interface.Some key features of Stashboard include:Simple and clean visual status display showing...
SumAll is a cloud-based social media analytics platform designed to help marketers and businesses aggregate and analyze data from multiple social media channels. It pulls metrics from popular platforms like Facebook, Twitter, Instagram, YouTube, and LinkedIn into one centralized dashboard to give users a holistic view of their social media...
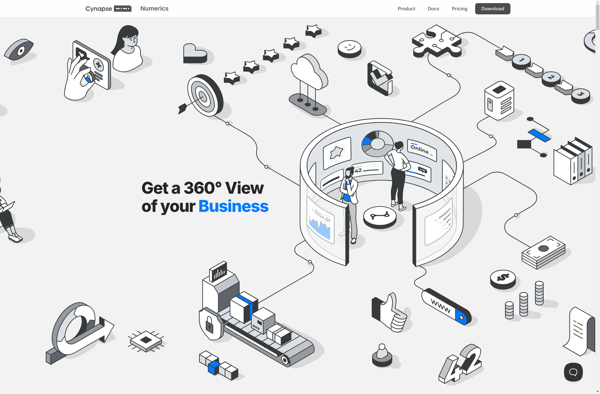
Numerics is an open-source data analysis and visualization application designed for engineering, science, finance, and other domains that work with numeric data. It provides a flexible platform for analyzing, transforming, and visualizing numeric datasets of virtually any size and dimension.Some of the key features and capabilities of Numerics include:Importing and...
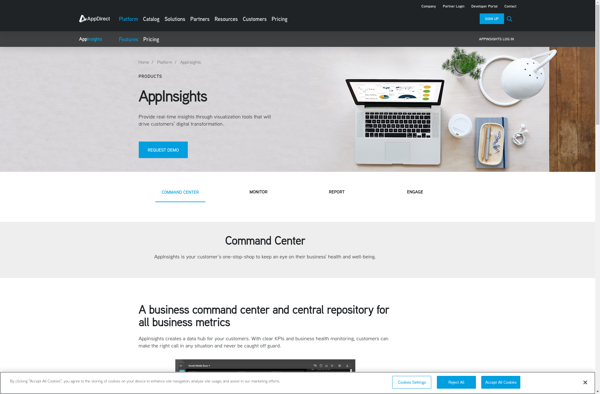
AppInsights is an extensive application performance management (APM) service provided by Microsoft Azure. It allows developers to easily monitor their live web applications and track key metrics like response time, failure rates, dependency rates, and more. Some key capabilities of AppInsights:Monitor response time, failure rates, exceptions to identify performance issues...
Whatagraph is a robust yet easy-to-use data visualization and reporting platform suitable for business users of all backgrounds. With an intuitive drag-and-drop interface, anyone can create interactive dashboards, charts, maps, and graphs that automatically update when data changes.Whatagraph connects directly to data sources like MySQL, PostgreSQL, Excel, Google Sheets, and...
jSlate is an open-source vector graphics and diagramming web application for creating a wide variety of diagrams and sketches. With its intuitive drag-and-drop interface, jSlate makes it easy for users to construct flowcharts, UML diagrams, user interface mockups, network diagrams, organizational charts, and more.Some key features of jSlate include:Drag-and-drop shapes...